

Introduction
This Bengaluru T20I pitch report looks at M. Chinnaswamy Stadium for India vs West Indies.
M. Chinnaswamy Stadium is in Bengaluru, India. It is Karnataka’s home ground. It is a key India venue. It hosts Test, ODI and T20 cricket. This report covers men’s T20Is only. It leaves out IPL, domestic and women’s games.
India and West Indies meet here in the fifth T20I. The match is on 17 October 2026 at 7:00 PM IST. It stayed on the official schedule at the 2 October 2026 cut-off. The BCCI fixture release gives the date, city and time. The ESPNcricinfo fixture names the ground.
The T20I record is small. It has range. Ten matches are listed. Nine were completed. One ended after 3.3 overs. The mean first-innings score is 161.67. The mean second-innings score is 154.44. Both means use nine matches. A 194/3 chase shows the high end. Two totals reached 212. A 122/9 score shows the low end. So does a 127 all-out reply. See our Bengaluru ODI pitch report for the ODI view.
On This Page
Match Schedule
| Match | Series | Date | Time | Format |
|---|---|---|---|---|
| India Vs West Indies, 5th T20I | West Indies Tour Of India 2026–27 | Saturday, 17 October 2026 | 7:00 PM IST | Men’s T20I |
The BCCI release lists five T20Is. They run from 6 to 17 October. Bengaluru hosts the last match. ESPNcricinfo lists a 19:00 local start. The first session runs from 19:00 to 20:30. The second runs from 20:50 to 22:20.
Bengaluru T20I Pitch Report
Past men’s T20I scorecards show high scores. They do not show one set result. India made 202/6 against England in 2017. Australia chased 190 in 2019. The final score was 194/3. India defended 160/8 against Australia in 2023. In 2024, both India and Afghanistan made 212.
The record does not prove all games will be batting shootouts. A good batting phase can make a big total. Lost wickets can cut a score. The best ground read is high scoring potential with real value in wicket-taking overs.
Ground T20I Statistics
This table uses this ground only. It covers men’s T20Is through 2 October 2026. The means use nine completed matches. Each column has nine innings.
| Statistic | Ground Record |
|---|---|
| Total T20Is Listed | 10 |
| Completed T20Is | 9 |
| Mean First-Innings Score | 161.67 (1,455 runs / 9 innings) |
| Mean Second-Innings Score | 154.44 (1,390 runs / 9 innings) |
| Highest Completed Team Total | India 212/4, 2024 |
| Lowest Completed Team Total | Sri Lanka 122/9, 2016 |
| Highest Successful Chase | Australia 194/3, 2019 |
| Wins Batting First, Resolved Result | 4 |
| Wins Batting Second | 5 |
| Regulation Ties | 1; India Vs Afghanistan, 2024, then won after super overs |
| No Results | 1; India Vs South Africa, 2022 |
Take care with the result split. Howstat lists four batting-first wins. It lists five batting-second wins. It lists one no result. It puts the 2024 India–Afghanistan result under India. India batted first. The regulation score was tied at 212–212. India won after super overs. This was not a normal 20-over batting-first win.
There is also a source display mismatch. Howstat’s overview shows 127 as the lowest team innings. Its exact-ground list shows Sri Lanka at 122/9. The linked 2016 scorecard shows the same. This report uses 122/9. The source conflict is stated here.
The 2022 no-result is not part of either mean. India had made only 28/2 in 3.3 overs when rain ended the match. That fragment was not a full innings. Counting it as a full second innings would give a false view.
Detailed Pitch Behaviour
Batting Conditions
Set batters can make big totals here. India reached 202/6 in 2017. Rohit Sharma made 121 not out from 69 balls in 2024. Rinku Singh made 69 not out from 39 balls. Glenn Maxwell made 113 not out from 55 balls. That came in the 194/3 chase in 2019.
The record also shows the cost of early wickets. India were 134/9 in 2019. South Africa then chased 140/1. Sri Lanka made 122/9 in 2016. The lesson is simple. Early intent helps. Wickets in hand matter more than a ground label.
The scorecards do not measure bounce. They do not measure seam or turn. This report makes no fixed movement claim. Runs and wickets are firmer evidence.
Fast Bowling
Seam bowlers have made key spells. Mukesh Kumar took 3/32 against Australia in 2023. Jason Behrendorff took two wickets in that match. Ben Dwarshuis took two as well. Bumrah took no wickets when Australia chased 194 in 2019. That match does not prove a pace edge for wickets.
The record supports pace in the first six overs. It also supports pace in the last five. Pace alone does not win here. Figures range from Bhuvneshwar Kumar’s 3/9 to costly spells. Bumrah was 0/30 in 2019. The best plans mix wickets, lines and pace changes.
Spin Bowling
Spin has a strong middle-overs record. Yuzvendra Chahal took 6/25 against England in 2017. He leads this ground with six wickets. Howstat’s exact-ground bowling table gives Adam Zampa a best of 3/23 here. It gives Shakib Al Hasan four venue wickets. Zampa took 0/23 when Australia chased 194 in 2019. So, 3/23 is not from that game.
These figures show that spin can cut runs and take wickets. They do not prove that the surface always turns. Batters have lost wickets while attacking spin in the middle overs.
Phase-Wise Pitch Behaviour
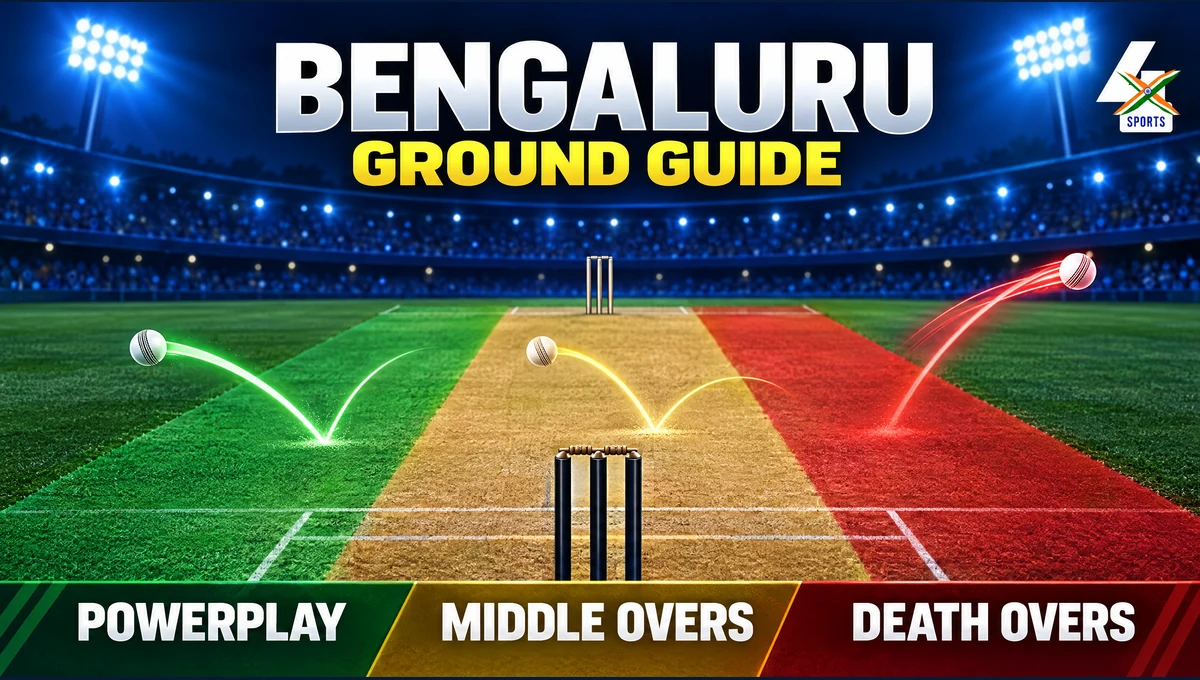
Powerplay, Overs 1–6: The eight-match ball-by-ball archive subset produced 702 runs from 576 legal balls. That is 7.31 runs per over. India scored 53 in the first six overs in 2017. England’s chase then lost wickets soon after its strong start. The first six can set an innings. The scorecards do not show a risk-free phase.
Middle, Overs 7–15: The same archive subset produced 1,070 runs from 864 legal balls. The rate was 7.43 per over. This is close to the powerplay rate. Wickets have often decided this phase. Chahal’s 6/25 in 2017 and Maxwell’s 113 in 2019 show two ways the middle can shape a game.
Final, Overs 16–20: The archive subset produced 649 runs from 417 legal balls. The rate was 9.34 per over. India added 70 runs in the last five overs of the 202/6 innings in 2017. England added only four in its reply after losing its lower order. The last phase rewards a side that keeps wickets. It can also expose a weak tail.
The phase totals cover eight full-match Cricsheet files. They exclude the 2022 rain fragment. The 2024 scorecard is in the ground totals. It is also in the leaderboards. It is not in this phase subset. Wides and no-balls count as runs. Only legal balls count in the rate denominator.
Recent T20I Trends
| Date | First Innings | Second Innings | Result |
|---|---|---|---|
| 1 February 2017 | India 202/6 | England 127 all out | India won by 75 runs |
| 27 February 2019 | India 190/4 | Australia 194/3 | Australia won by 7 wickets |
| 22 September 2019 | India 134/9 | South Africa 140/1 | South Africa won by 9 wickets |
| 19 June 2022 | India 28/2 in 3.3 overs | South Africa did not bat | No result; rain |
| 3 December 2023 | India 160/8 | Australia 154/8 | India won by 6 runs |
| 17 January 2024 | India 212/4 | Afghanistan 212/6 | Regulation tie; India won after super overs |
The recent record gives three points. First, a total over 190 is not always safe. Australia chased 191 in 2019. Second, 160 beat Australia in 2023. India took wickets and defended it. Third, 2024 showed the top end. It had 424 regulation runs.
The 2022 match is a no-result. It is not a low-scoring completed game. Its 28/2 after 3.3 overs is excluded from the mean scores and phase rates. This keeps the trend tied to completed innings.
Top Batters
These are the exact-ground top 10 men’s T20I batters by runs. The rows come from Howstat’s ground table. ESPNcricinfo’s ground page was checked too. Its fetched view lacks the full aggregate table. Howstat’s rows were checked against linked scorecards. Matches means ground appearances. It does not mean batting innings.
| Player | Country | Matches | Runs | 50s | 100s | Highest Score | Average |
|---|---|---|---|---|---|---|---|
| Rohit Sharma | India | 4 | 150 | 0 | 1 | 121* | 50.00 |
| Glenn Maxwell | Australia | 2 | 139 | 0 | 1 | 113* | 139.00 |
| Virat Kohli | India | 6 | 116 | 1 | 0 | 72* | 23.20 |
| MS Dhoni | India | 4 | 110 | 1 | 0 | 56 | 36.67 |
| Suresh Raina | India | 3 | 103 | 1 | 0 | 63 | 34.33 |
| Andre Fletcher | West Indies | 1 | 84 | 1 | 0 | 84* | Unavailable |
| Quinton de Kock | South Africa | 2 | 79 | 1 | 0 | 79* | Unavailable |
| Rinku Singh | India | 2 | 75 | 1 | 0 | 69* | 75.00 |
| Shikhar Dhawan | India | 3 | 73 | 0 | 0 | 36 | 24.33 |
| KL Rahul | India | 2 | 69 | 0 | 0 | 47 | 34.50 |
The batting averages are for this ground. They are not career figures. They use runs per dismissal in the listed innings. Howstat leaves Fletcher and de Kock blank. Neither was dismissed in the listed innings. No denominator is invented.
Rohit’s 121 not out is the top score here. Maxwell’s 113 not out is second. Andre Fletcher’s 84 not out is the top West Indies score in this table.
Top Bowlers
These are the exact-ground top 10 men’s T20I bowlers by wickets. The rows come from Howstat’s ground table. The figures are ground-only. Economy is runs per over. Average is runs per wicket. Strike rate is legal balls per wicket. BBI is best bowling in an innings.
| Player | Country | Matches | Wickets | Economy | Average | Strike Rate | BBI |
|---|---|---|---|---|---|---|---|
| Yuzvendra Chahal | India | 3 | 6 | 9.00 | 12.00 | 8.00 | 6/25 |
| Mustafizur Rahman | Bangladesh | 2 | 4 | 8.00 | 16.00 | 12.00 | 2/30 |
| Shakib Al Hasan | Bangladesh | 2 | 4 | 6.25 | 12.50 | 12.00 | 3/27 |
| Adam Zampa | Australia | 2 | 3 | 5.75 | 15.33 | 16.00 | 3/23 |
| Al-Amin Hossain | Bangladesh | 2 | 3 | 8.50 | 17.00 | 12.00 | 2/37 |
| Bhuvneshwar Kumar | India | 2 | 3 | 2.25 | 3.00 | 8.00 | 3/9 |
| Fareed Ahmad | Afghanistan | 1 | 3 | 5.00 | 6.67 | 8.00 | 3/20 |
| Hardik Pandya | India | 4 | 3 | 9.86 | 23.00 | 14.00 | 2/29 |
| Jasprit Bumrah | India | 3 | 3 | 7.24 | 25.33 | 21.00 | 3/14 |
| Jason Behrendorff | Australia | 2 | 3 | 7.86 | 18.33 | 14.00 | 2/38 |
Chahal leads with six wickets. His 6/25 is also the best innings bowling figure at the ground. Bhuvneshwar’s 3/9 is the best economy entry in this top-10 table. West Indies also has ground entries beyond this cut. Samuel Badree took 3/12. Dwayne Bravo took 2/20. Neither reached the top 10 by wickets.
Upcoming Matches
| Date | Match | Series | Format | Time |
|---|---|---|---|---|
| 17 October 2026 | India Vs West Indies, 5th T20I | West Indies Tour Of India 2026–27 | Men’s T20I | 7:00 PM IST |
This is the only future match at M. Chinnaswamy Stadium in the checked BCCI schedule. The BCCI release is the schedule source. ESPNcricinfo lists the same match at 19:00 local time. It is a night T20I.
No playing XI is projected here. The leader tables are venue records. They are not a team sheet.
Key Ground Records
- Most T20I runs: Rohit Sharma, 150 in four matches.
- Highest individual T20I score: Rohit Sharma, 121 not out against Afghanistan in 2024.
- Most T20I wickets: Yuzvendra Chahal, six in three matches.
- Best T20I bowling: Yuzvendra Chahal, 6/25 against England in 2017.
- Highest completed team total: India, 212/4 against Afghanistan in 2024.
- Other 212 total: Afghanistan made 212/6 in the same tied match.
- Highest successful chase: Australia, 194/3 against India in 2019.
- Lowest completed team total: Sri Lanka, 122/9 against West Indies in 2016.
- Only regulation tie: India and Afghanistan, 212–212 in 2024; India won after super overs.
- Only no-result: India and South Africa in 2022, abandoned after 3.3 overs.
FAQs
Is M. Chinnaswamy Stadium Batting-Friendly For Men’s T20Is?
It has strong scoring potential. It does not promise a batting result. The ground has two 212 totals. It has a 194/3 chase. It has also produced 122/9 and 127 all out. Middle-overs wickets can change the match.
What Is The Mean T20I Score At M. Chinnaswamy Stadium?
The mean first-innings score is 161.67. It uses 1,455 runs in nine innings. The mean second-innings score is 154.44. It uses 1,390 runs in nine innings. The 2022 rain fragment is out.
Are Spinners Important At The Venue?
Yes. Spin has a clear middle-overs role here. Yuzvendra Chahal took 6/25 against England. It is the best innings spell here. Fast bowlers have made strong spells too. The record supports a mixed attack.
Who Has The Highest T20I Score At M. Chinnaswamy Stadium?
Rohit Sharma has the top score. He made 121 not out against Afghanistan on 17 January 2024.
Who Has Scored The Most Men’s T20I Runs At The Ground?
Rohit Sharma leads. He has 150 runs in four ground matches. Glenn Maxwell is second. He has 139 in two matches.
Who Has Taken The Most Men’s T20I Wickets At The Ground?
Yuzvendra Chahal leads with six wickets in three matches. His best spell is 6/25.
