

Intro
India and Sri Lanka meet in the first T20I of the 2026–27 home series at Niranjan Shah Stadium, Rajkot, on Tuesday, 22 December 2026. The start is 7:00 pm IST. The venue is the same ground historically listed as Saurashtra Cricket Association Stadium, Khandheri; ESPNcricinfo’s ground profile records that former name and separates this venue from the older Madhavrao Scindia Cricket Ground in Rajkot. Source 1 Source 2
The evidence points to a high-scoring but not one-dimensional T20 surface. Across the six completed men’s T20Is in the exact-ground sample, first-innings teams averaged 186.33 and second-innings teams averaged 146.83. The ground record contains four wins batting first and two batting second, with no tie and no no-result. That split is not a promise that the toss decides the match: India chased 202 in 2013 and 154 in 2019, while England defended 171 in the most recent match. Source 3 Source 4
The headline ceiling is India’s 228/5 against Sri Lanka on 7 January 2023. The low is South Africa’s 87 all out against India on 17 June 2022. Those extremes explain the right way to read Rajkot: the pitch can reward clean strokeplay, but wickets in the middle overs can change a chase quickly. Source 3 Source 5
Match Schedule
| Match | Series | Date | Start | Venue |
|---|---|---|---|---|
| India vs Sri Lanka, 1st T20I | Sri Lanka tour of India 2026–27 | Tuesday, 22 December 2026 | 7:00 pm IST | Niranjan Shah Stadium, Rajkot |
The BCCI fixture release confirms the first T20I for Rajkot at 7:00 pm. The current ESPNcricinfo fixture page independently names Niranjan Shah Stadium, Rajkot and gives local hours of play as 19.00–22.20. Source 6 Source 7
Pitch Report & ground table
Niranjan Shah Stadium has a grass pitch and was established in 2009, according to ESPNcricinfo’s ground profile. The T20I record is small but clear. Howstat’s exact-ground overview lists six matches from 10 October 2013 to 28 January 2025, four wins batting first and two batting second. Its published average batting-first score is 186; the second-innings mean below is calculated from the complete six-match Cricsheet men’s T20 sample and is labelled accordingly. Source 1 Source 3 Source 8
| Exact-ground men’s T20I statistic | Record |
|---|---|
| Total men’s T20Is | 6 |
| Mean first-innings score | 186.33 |
| Mean second-innings score | 146.83 |
| Highest team total | 228/5, India (2023) |
| Lowest team total | 87, South Africa (2022) |
| Highest successful chase | 202/4, India (2013) |
| Wins batting first | 4 |
| Wins batting second | 2 |
| Ties | 0 |
| No-results | 0 |
Scope: the totals, means and phase figures are from all six exact-ground men’s T20Is in the downloaded Cricsheet t20s_male_json.zip archive, matched on Rajkot city and the venue string Saurashtra Cricket Association Stadium. Howstat’s six-match ground list and ESPNcricinfo’s exact-ground T20I records page were used as independent checks. The venue’s current name is Niranjan Shah Stadium; older scorecards use Saurashtra Cricket Association Stadium. No Madhavrao Scindia Cricket Ground match is included. Source 3 Source 4 Source 8 Source 9
The surface has repeatedly offered enough pace for a strong powerplay. In 2013, Australia made 74 in the first six overs and India began the chase with 53. In 2019, India’s 63 in the first six overs set up a chase of 154 in only 15.4 overs. The 2023 Sri Lanka match was even more emphatic: India reached 228/5, with Suryakumar Yadav’s unbeaten 112 from 51 balls providing the clearest example of value for attacking shots. Source 5 Source 10
Batting, pace, spin and phase analysis
Batting. Rajkot’s best batting performances have come from players who attacked the length rather than waiting for a late finish. Colin Munro’s unbeaten 109 from 58 balls in 2017 and Suryakumar Yadav’s 112 not out from 51 in 2023 are the two hundreds in the six-match sample. Aaron Finch made 89 from 52 in the 2013 chase, while Rohit Sharma’s 85 from 43 powered India past Bangladesh in 2019. The record therefore supports a batting-friendly description when batters win the early exchanges, but the 87 all out in 2022 and India’s 145/9 in 2025 show that the venue does not remove the value of disciplined bowling. Source 10 Source 11
Pace. Fast and seam bowling has produced match-turning spells. Avesh Khan returned 4/18 in India’s 82-run win over South Africa in 2022; Trent Boult took 4/34 in New Zealand’s 40-run win in 2017; and Jamie Overton took 3/24 while England defended 171 in 2025. The first-ground T20I in 2013 also featured three wickets each for Bhuvneshwar Kumar and R Vinay Kumar. These scorecards suggest that hard lengths, changes of pace and accurate death overs can still beat the strokeplay on offer. Source 11 Source 12 Source 13
Spin. Spin has not been a sideshow. Yuzvendra Chahal is the ground’s leading T20I wicket-taker with seven wickets in four matches, including 2/21 against South Africa and 2/28 against Bangladesh. Varun Chakravarthy’s 5/24 in 2025 is the best bowling innings at the venue, and he removed England’s middle and lower order as India held the visitors to 171/9. The evidence favours using spin through the middle overs when batters are forced to attack, rather than assuming that the surface is exclusively a pace venue. Source 3 Source 12
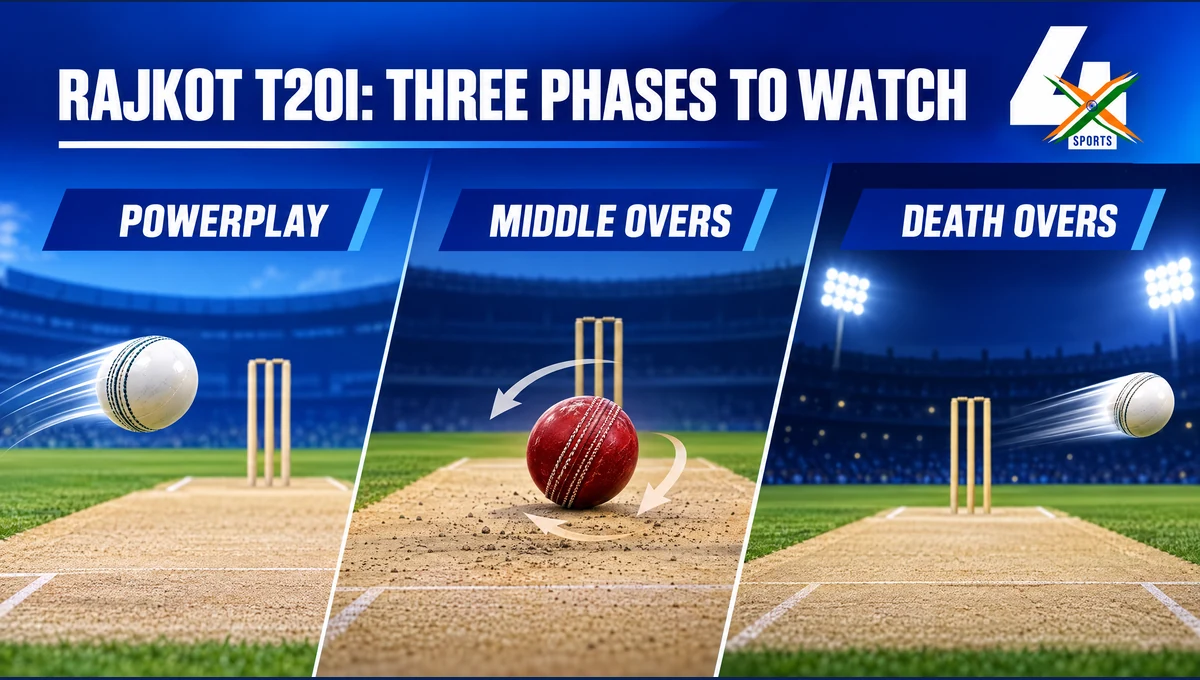
Phases. In the complete six-match Cricsheet sample, first innings produced 321 powerplay runs, 478 middle-over runs and 319 death-over runs. On legal-ball rates, that is approximately 8.92, 8.85 and 10.63 runs per over respectively. Chasing innings produced 293 powerplay runs, 421 middle-over runs and 167 death-over runs, or approximately 8.14, 7.80 and 8.87 per over; several chases ended before the 20th over, so the death phase has fewer balls. The practical reading is straightforward: a team that preserves wickets can cash in late, but middle-over wickets have repeatedly prevented targets from becoming routine. India’s 2023 innings moved from 53 in the powerplay to 111 in overs 7–15 before finishing on 228/5; South Africa’s 2022 chase lost six wickets in the middle phase and collapsed to 87. Source 9 Source 12
Recent ground match trends
| Date | First innings | Second innings | Result |
|---|---|---|---|
| 10 Oct 2013 | Australia 201/7 | India 202/4 (19.4 ov) | India won by 6 wickets |
| 4 Nov 2017 | New Zealand 196/2 | India 156/7 | New Zealand won by 40 runs |
| 7 Nov 2019 | Bangladesh 153/6 | India 154/2 (15.4 ov) | India won by 8 wickets |
| 17 Jun 2022 | India 169/6 | South Africa 87 all out (16.5 ov) | India won by 82 runs |
| 7 Jan 2023 | India 228/5 | Sri Lanka 137 all out (16.4 ov) | India won by 91 runs |
| 28 Jan 2025 | England 171/9 | India 145/9 | England won by 26 runs |
The sequence shows three useful patterns. First, 200-plus is chaseable when the top order stays ahead of the required rate, as India proved in 2013. Second, a total in the 150s can be enough if the bowling side takes wickets: New Zealand defended 196 comfortably in 2017, and England defended 171 in 2025. Third, the most recent three completed matches have been decisive rather than close: India won by 82 and 91 runs before England won by 26. The result history is not a substitute for a new scorecard, but it does show why both batting depth and wicket-taking options matter here. Source 8 Source 10 Source 11 Source 12
Top venue batters
These are the ten leading run-scorers in Howstat’s exact-ground men’s T20I table. A dash for average means the player was not dismissed in the listed innings; the table preserves the source’s genuine venue records rather than inventing a denominator. Source 14
| Player | Country | Matches | Runs | 50 | 100 | HS | Average |
|---|---|---|---|---|---|---|---|
| Suryakumar Yadav | India | 2 | 126 | 0 | 1 | 112* | 126.00 |
| Colin Munro | New Zealand | 1 | 109 | 0 | 1 | 109* | — |
| Rohit Sharma | India | 3 | 98 | 1 | 0 | 85 | 32.67 |
| Virat Kohli | India | 2 | 94 | 1 | 0 | 65 | 47.00 |
| Hardik Pandya | India | 4 | 91 | 0 | 0 | 46 | 22.75 |
| Aaron Finch | Australia | 1 | 89 | 1 | 0 | 89 | 89.00 |
| Yuvraj Singh | India | 1 | 77 | 1 | 0 | 77* | — |
| MS Dhoni | India | 2 | 73 | 0 | 0 | 49 | 73.00 |
| Shikhar Dhawan | India | 3 | 64 | 0 | 0 | 32 | 21.33 |
| Dinesh Karthik | India | 1 | 55 | 1 | 0 | 55 | 55.00 |
Top venue bowlers
These ten entries are the leading wicket-takers in Howstat’s exact-ground men’s T20I table. Economy, average and strike rate are the source’s runs-per-over, runs-per-wicket and legal-balls-per-wicket measures. Source 15
| Player | Country | Matches | Wickets | Econ | Average | SR | BBI |
|---|---|---|---|---|---|---|---|
| Yuzvendra Chahal | India | 4 | 7 | 7.67 | 16.43 | 12.86 | 2/21 |
| Varun Chakravarthy | India | 1 | 5 | 6.00 | 4.80 | 4.80 | 5/24 |
| Avesh Khan | India | 1 | 4 | 4.50 | 4.50 | 6.00 | 4/18 |
| Hardik Pandya | India | 4 | 4 | 8.90 | 22.25 | 15.00 | 2/30 |
| Trent Boult | New Zealand | 1 | 4 | 8.50 | 8.50 | 6.00 | 4/34 |
| Axar Patel | India | 4 | 3 | 7.48 | 32.00 | 25.67 | 1/19 |
| Arshdeep Singh | India | 1 | 3 | 7.50 | 6.67 | 5.33 | 3/20 |
| Bhuvneshwar Kumar | India | 3 | 3 | 7.20 | 24.00 | 20.00 | 3/35 |
| Jamie Overton | England | 1 | 3 | 6.00 | 8.00 | 8.00 | 3/24 |
| R Vinay Kumar | India | 1 | 3 | 6.50 | 8.67 | 8.00 | 3/26 |
Upcoming fixtures at the exact ground
| Date | Match | Series | Format | Start |
|---|---|---|---|---|
| 22 Dec 2026 | India vs Sri Lanka, 1st T20I | Sri Lanka tour of India 2026–27 | Men’s T20I | 7:00 pm IST |
This is the only upcoming fixture listed here because it is the requested match and the current ESPNcricinfo fixture page explicitly names Niranjan Shah Stadium. Source 7
FAQs
Is Niranjan Shah Stadium batting-friendly?
The exact-ground sample supports a high-scoring potential label, not an automatic batting guarantee. The first-innings mean is 186.33, with totals of 228/5, 201/7 and 196/2, but South Africa were dismissed for 87 in 2022 and India made 145/9 in 2025. Source 3 Source 8
Is spin important at Rajkot?
Yes. Yuzvendra Chahal has seven exact-ground T20I wickets and Varun Chakravarthy’s 5/24 is the venue’s best innings. Pace has also been decisive, so the record favours a balanced attack rather than a spin-only reading. Source 3 Source 15
What is the highest team score at Niranjan Shah Stadium?
India’s 228/5 against Sri Lanka on 7 January 2023 is the highest men’s T20I team total in the exact-ground record. Source 3 Source 5
Who has scored the most runs at the ground?
Suryakumar Yadav leads the exact-ground men’s T20I aggregate with 126 runs, including an unbeaten 112. Colin Munro is second with 109 not out. Source 14
Who has taken the most wickets at the ground?
Yuzvendra Chahal leads with seven wickets in four men’s T20Is. Varun Chakravarthy is second with five wickets from one match. Source 15
References
More in this series: six-match tour schedule, Delhi Odi report, Bengaluru Odi report.
