

Introduction
This Lucknow T20I pitch report looks at the Ekana ground for India vs West Indies.
Ekana Stadium is in Lucknow, Uttar Pradesh. Its full name is Bharat Ratna Shri Atal Bihari Vajpayee Ekana Cricket Stadium. The ground hosts India games, the IPL and local cricket. This report covers only men’s T20Is here.
India and West Indies meet here on Tuesday, 6 October 2026. It is the first T20I of the 2026–27 tour. The match starts at 7:00 PM IST. Six completed men’s T20Is form the main sample. That sample shows both high totals and low scores. India made 199/2 in 2022. New Zealand made 99/8 in 2023. The ground does not fit one simple label. Timing, shot choice and middle-over wickets all matter.
On This Page
Match Schedule
The BCCI home schedule lists the city and 7:00 PM start. The ESPNcricinfo fixture names Ekana Stadium.
| Match | Series | Date | Time | Format |
|---|---|---|---|---|
| India Vs West Indies, 1st T20I | West Indies Tour Of India 2026–27 | Tuesday, 6 October 2026 | 7:00 PM IST | Men’s T20I |
The ground is Bharat Ratna Shri Atal Bihari Vajpayee Ekana Cricket Stadium, Lucknow. The 2018 scorecard uses an older name. That name is Ekana International Cricket Stadium, Lucknow. Both names mean this same ground. The venue is still in Lucknow.
Lucknow T20I Pitch Report
Ekana has seen high totals. It has also seen tight games. India’s 195/2 against West Indies came in 2018. India’s 199/2 against Sri Lanka came in 2022. These are the top totals in the sample. New Zealand made 99/8 in 2023. That is the low team score in the sample. New Zealand were not all out.
The scorecards give useful clues. New Zealand found runs hard to get in 2023. India needed 19.5 overs to make 101/4. In the 2019 Afghanistan–West Indies games, cutters and slower balls drew mistimed shots. The record backs a calm start and deep batting. It also shows why scores can vary.
Ground T20I Statistics
The Howstat match list covers six games. The ESPNcricinfo exact-ground records give a second check. Both sources cover six completed men’s T20Is. The cut-off is 2 October 2026. Each innings average uses six innings as its denominator.
| Statistic | Record |
|---|---|
| Completed Men’s T20Is | 6 |
| Mean First-Innings Score | 160.00 (960 runs ÷ 6) |
| Mean Second-Innings Score | 121.50 (729 runs ÷ 6) |
| Highest Team Total | India 199/2, 2022 |
| Lowest Completed Team Innings | New Zealand 99/8, 2023 |
| Highest Successful Chase | India 101/4, 2023 |
| Wins Batting First | 5 |
| Wins Batting Second | 1 |
| Ties | 0 |
| No Results In Completed Sample | 0 |
Howstat lists one more 2025 ground record. It is India Vs South Africa. That match was abandoned. We do not use it here. It is not in the averages. It is not in the result split. It is not in the player tables. Those parts use six games.
“Lowest completed team innings” means the lowest total in six games. New Zealand made 99/8. They were not all out. Howstat’s overview says “No completed innings”. That is its label for the same field. This report uses the six-game math. It gives the denominator too. The source label and this sample do not match. The number stays as found.
Detailed Pitch Behaviour
Batting Conditions
The two top totals came when India kept wickets in hand. Rohit Sharma made 111* from 61 balls in 2018. Ishan Kishan made 89 from 56 balls in 2022. Both innings show the value of clean timing. They also show the value of a batter who settles first.
The 2019 scorecards show a different side. In the second match, the commentary says batters had to make their own pace. One change-up “stuck in the pitch”. It caused a mistimed shot. The 2018 commentary notes less pace off the pitch. It was on a wicket. These are events from named matches. They are not claims about every future game.
Fast Bowling
Accurate seam bowling has worked in both innings. Bhuvneshwar Kumar took 2/9 in 2022. Arshdeep Singh took 2/7 in 2023. Jasprit Bumrah took 2/20 in 2018.
Changes of pace have also worked. Kesrick Williams took 3/17 in the first 2019 match. He took 3/23 in the second. His wicket notes include slower balls and off-cutters. Medium-pacer Karim Janat took 5/11 against West Indies in 2019. The evidence supports pace changes and a good line. It does not prove a constant seam or bounce edge.
Spin Bowling
Spin has taken wickets at Ekana. Kuldeep Yadav took 2/32 against West Indies in 2018. Yuzvendra Chahal took 1/4 in the low-scoring 2023 game. Janat’s 5/11 was a medium-pace spell. It was not a spin record.
The record points to control and change. It does not show that spin alone wins games. Bhuvneshwar, Bumrah and Arshdeep also rank among the ground’s top wicket-takers. Their economy adds to the picture. So does their match impact.
Phase-Wise Pitch Behaviour
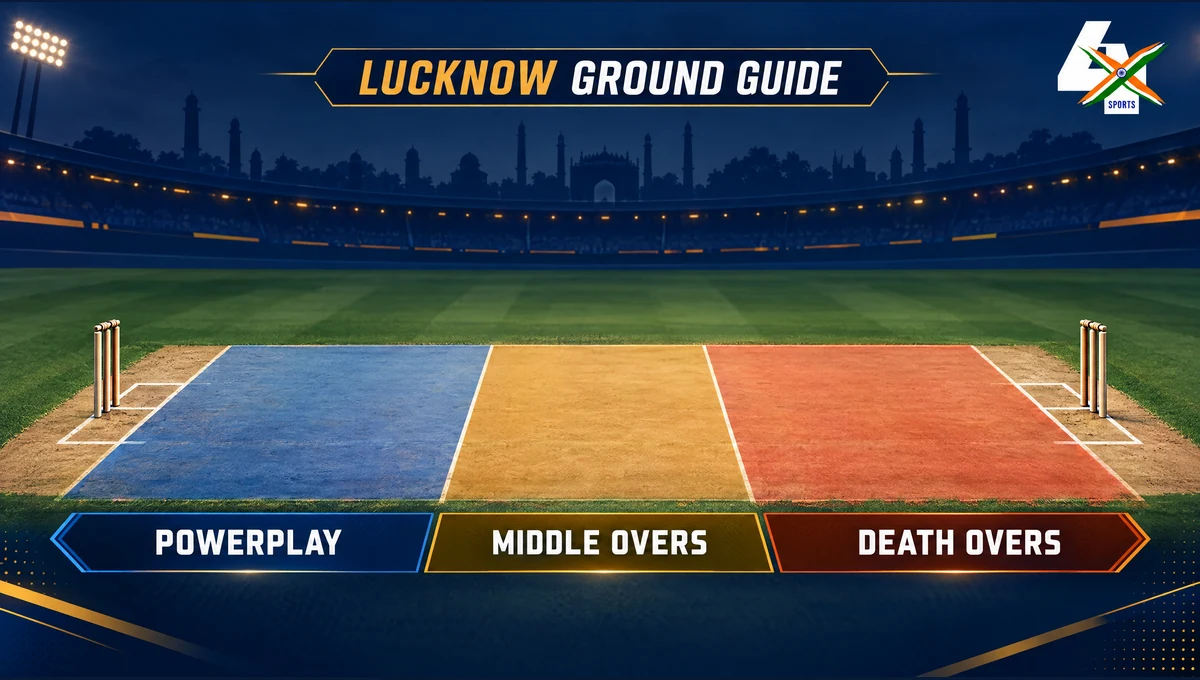
T20I phases use Powerplay 1–6, Middle 7–15 and Final 16–20. The ball sample covers three exact-ground matches. Those matches are in the Cricsheet men’s T20 archive. The years are 2018, 2022 and 2023. This is not a six-match phase average.
Powerplay 1–6: The six scorecards give first-innings powerplays of 49, 52, 38, 32, 58 and 33 runs. The mean is 43.67 runs from six powerplays. Second-innings powerplays were 39, 38, 32, 32, 29 and 29. Their mean was 33.17. Early wickets lowered the chase figure in several games. It is not a rule for the next match.
Middle 7–15: The three-match ball sample produced 190 first-innings runs. It used 162 legal balls. That rate is 7.04 runs per six legal balls. The second innings produced 150 runs from 162 legal balls. That rate is 5.56. New Zealand were 48/4 at halfway in 2023. The 2019 cards also record wickets after batters forced the pace.
Final 16–20: The same three-match sample produced 163 first-innings runs. It used 90 legal balls. That rate is 10.87 runs per six legal balls. The second innings produced 115 from 87 legal balls. That rate is 7.93. A short chase affects the second denominator. Late scoring can rise when wickets remain. Slower balls can still end an innings.
Recent T20I Trends
The latest completed men’s T20I at Ekana was India Vs New Zealand. The game was on 29 January 2023. New Zealand made 99/8. India reached 101/4 in 19.5 overs. India won by six wickets. Suryakumar Yadav was unbeaten on 26. Chahal and Arshdeep kept New Zealand down.
Before that game, India made 199/2 against Sri Lanka. It was on 24 February 2022. Sri Lanka replied with 137/6. India scored 58 runs in the powerplay. That start set the tone. Sri Lanka’s 29/2 start shows how fast a chase can lose pace.
The three Afghanistan–West Indies games came in November 2019. The first innings ended at 164/5, 147/7 and 156/8. The side batting first won all three games. West Indies made 134/9, 106/8 and 127/7 in reply. The recent record gives a clear view. High scoring is possible. Wickets also matter. Pace changes matter too.
Top Batters
This is the exact-ground men’s T20I list by total runs. The rows use Howstat’s ground batting table. ESPNcricinfo’s exact-ground men’s T20I records provide a check. Matches means appearances. It does not mean batting innings. A dash means the source has no count of dismissals. The source therefore gives no average.
| Player | Country | Matches | Runs | 50s | 100s | Highest Score | Average |
|---|---|---|---|---|---|---|---|
| Rohit Sharma | India | 2 | 155 | 0 | 1 | 111* | 155.00 |
| Ishan Kishan | India | 2 | 108 | 1 | 0 | 89 | 54.00 |
| Evin Lewis | West Indies | 3 | 106 | 1 | 0 | 68 | 35.33 |
| Rahmanullah Gurbaz | Afghanistan | 3 | 94 | 1 | 0 | 79 | 31.33 |
| Najibullah Zadran | Afghanistan | 3 | 61 | 0 | 0 | 27 | 30.50 |
| Shai Hope | West Indies | 2 | 58 | 1 | 0 | 52 | 29.00 |
| Shimron Hetmyer | West Indies | 4 | 58 | 0 | 0 | 21 | 14.50 |
| Shreyas Iyer | India | 1 | 57 | 1 | 0 | 57* | — |
| Asghar Afghan | Afghanistan | 3 | 57 | 0 | 0 | 25 | 19.00 |
| Kieron Pollard | West Indies | 4 | 56 | 0 | 0 | 32* | 18.67 |
Rohit leads with 155 runs. His 111* came in 2018. Ishan is second with 108. A player needs a row here to lead this ground list.
Top Bowlers
These are the exact-ground men’s T20I wicket leaders. They are ranked by total wickets. The source is Howstat’s bowling table. Economy means runs per over. Average means runs per wicket. Strike rate means legal balls per wicket. These are ground records. They are not career figures.
| Player | Country | Matches | Wickets | Economy | Average | Strike Rate | BBI |
|---|---|---|---|---|---|---|---|
| Kesrick Williams | West Indies | 3 | 8 | 5.92 | 8.88 | 9.00 | 3/17 |
| Karim Janat | Afghanistan | 2 | 6 | 5.50 | 7.33 | 8.00 | 5/11 |
| Naveen-Ul-Haq | Afghanistan | 3 | 5 | 7.45 | 16.40 | 13.20 | 3/24 |
| Bhuvneshwar Kumar | India | 2 | 4 | 3.50 | 5.25 | 9.00 | 2/9 |
| Gulbadin Naib | Afghanistan | 3 | 4 | 6.55 | 18.00 | 16.50 | 2/24 |
| Keemo Paul | West Indies | 3 | 4 | 7.64 | 21.00 | 16.50 | 2/26 |
| Jason Holder | West Indies | 3 | 3 | 6.50 | 26.00 | 24.00 | 2/23 |
| Kieron Pollard | West Indies | 4 | 3 | 6.86 | 16.00 | 14.00 | 2/17 |
| Kuldeep Yadav | India | 2 | 3 | 6.13 | 16.33 | 16.00 | 2/32 |
| Rashid Khan | Afghanistan | 3 | 3 | 6.42 | 25.67 | 24.00 | 1/18 |
Kesrick Williams leads with eight wickets. Janat is second with six. Janat also has the best innings figures, 5/11. The list includes seam and spin bowlers. The ground record supports variety.
Upcoming Matches
The BCCI schedule lists one upcoming men’s T20I here. The other four series games are elsewhere. They are in other cities.
| Date | Match | Series | Format | Time | Venue |
|---|---|---|---|---|---|
| 6 October 2026 | India Vs West Indies, 1st T20I | West Indies Tour Of India 2026–27 | Men’s T20I | 7:00 PM IST | Lucknow |
The second T20I is in Ranchi on 9 October. The third is in Indore on 11 October. The fourth is in Hyderabad on 14 October. The fifth is in Bengaluru on 17 October. These grounds are outside this report’s stats. They are not part of the ground sample. A team update is in the verified 4xSports India–West Indies T20I squad report.
Key Ground Records
- Most completed men’s T20Is: 6.
- Highest team total: India 199/2 Vs Sri Lanka, 24 February 2022.
- Lowest recorded team innings in the completed sample: New Zealand 99/8 Vs India, 29 January 2023. It was not all out.
- Highest successful chase: India 101/4 Vs New Zealand, 29 January 2023.
- Highest individual score: Rohit Sharma 111* Vs West Indies, 6 November 2018.
- Best bowling figures: Karim Janat 5/11 Vs West Indies, 16 November 2019.
- Most venue runs: Rohit Sharma, 155.
- Most venue wickets: Kesrick Williams, 8.
- Wins batting first: 5.
- Wins batting second: 1.
- Ties and completed no-results: 0 and 0.
FAQs
Is Ekana Stadium Batting-Friendly For T20Is?
It can support big scores. The record is mixed. The first-innings mean is 160.00 from six completed games. India made 199/2 and 195/2. New Zealand made 99/8 in 2023. Careful shots and deep batting help.
Are Spinners Important At Ekana Stadium?
Yes, especially in the middle overs. Karim Janat took 5/11 in 2019. Kuldeep Yadav and Yuzvendra Chahal also took key wickets here. Seamers with pace changes have done well too. Variety matters.
Who Has The Highest T20I Score At Ekana Stadium?
Rohit Sharma has the highest individual men’s T20I score. He made 111 not out. The innings used 61 balls. It was against West Indies on 6 November 2018.
Who Has Scored The Most T20I Runs At Ekana Stadium?
Rohit Sharma leads the exact-ground men’s T20I list. He has 155 runs in two matches. Ishan Kishan is second with 108.
Who Has Taken The Most T20I Wickets At Ekana Stadium?
Kesrick Williams leads with eight wickets in three matches. Karim Janat follows with six wickets.
What Is The Average First-Innings T20I Score At Ekana Stadium?
The mean first-innings score is 160.00. It uses 960 runs from six completed first innings. The mean second-innings score is 121.50. It uses 729 runs from six completed second innings. The abandoned 2025 game is excluded.
Is Chasing Easy At Ekana Stadium?
The completed record does not show that. Teams batting first won five of six games. India’s 101/4 in 19.5 overs is the only successful chase. The highest successful chase is therefore 101/4.
For ball-by-ball phase data, see the Cricsheet men’s T20I archive. The venue player tables are linked above. The match list is linked above too.
