

Pune’s men’s T20I record is small but unusually revealing. Five completed internationals at the historical ground now indexed by ESPNcricinfo as the Maharashtra Cricket Association Stadium, Pune show a venue capable of both a 101 all-out collapse and totals above 200. The numbers point to a surface on which good batting is rewarded once a player gets in, while pace remains the principal source of wickets and spin becomes especially relevant through the middle overs.
The next city fixture is India vs Sri Lanka, the third T20I, on 27 December 2026 at 7:00 pm IST in Pune. BCCI’s published schedule confirms Pune, the date and the local start time; it does not name the Maharashtra Cricket Association Stadium as the exact ground. This article therefore separates the historical ground record from the city-only fixture. For series context, see the Sri Lanka in India 2026/27 series guide.
Pune city fixture: 27 December 2026
| Date | Match | Series | Time | Location status |
|---|---|---|---|---|
| 27 December 2026 | India vs Sri Lanka, 3rd T20I | Sri Lanka tour of India 2026/27 | 7:00 pm IST | Pune city confirmed; exact stadium not named in the cited BCCI schedule |
The city, date and time are also listed by ICC and ESPNcricinfo. Until an official release identifies the ground, it would be inaccurate to describe this as a confirmed fixture at MCA Stadium.
Maharashtra Cricket Association Stadium pitch report: five verified men’s T20Is
| Exact-ground men’s T20I statistic | Record |
|---|---|
| Completed matches | 5 |
| Average first-innings score | 169.20 |
| Average second-innings score | 148.40 |
| Highest team total | Sri Lanka 206/6 (2023) |
| Lowest team total | India 101 all out (2016) |
| Highest successful chase | India 158/5 (2012) |
| Wins batting first | 3 |
| Wins batting second | 2 |
| Ties / no-results | 0 / 0 |
Recent T20I scorecards at the stadium
| Date | Match | First innings | Second innings | Result |
|---|---|---|---|---|
| 20 Dec 2012 | India vs England, 1st T20I | England 157/6 | India 158/5 | India won by 5 wickets |
| 9 Feb 2016 | India vs Sri Lanka, 1st T20I | India 101 all out | Sri Lanka 105/5 | Sri Lanka won by 5 wickets |
| 10 Jan 2020 | India vs Sri Lanka, 3rd T20I | India 201/6 | Sri Lanka 123 all out | India won by 78 runs |
| 5 Jan 2023 | Sri Lanka vs India, 2nd T20I | Sri Lanka 206/6 | India 190/8 | Sri Lanka won by 16 runs |
| 31 Jan 2025 | India vs England, 4th T20I | India 181/9 | England 166 all out | India won by 15 runs |
Across the five first innings, the aggregate is 846 runs, or a 169.20 average. The five second innings total 742, averaging 148.40. The highest team total is Sri Lanka 206/6 in 2023; the lowest is India 101 all out in 2016. The best successful chase is India 158/5 in 2012. Teams batting first have won three times and teams batting second twice, with no tie or no-result.
What the numbers say about batting
The record supports a batting-friendly interpretation only with qualification. Two totals above 200 show that the pitch can allow clean strokeplay and a strong finishing phase. In 2020, India reached 201/6 after scoring 63 in the powerplay, 75 in the middle and 63 at the death. In 2023, Sri Lanka made 206/6, with 55 in the powerplay, 74 in the middle and 77 at the death. Those are complete innings: runs were available early, but the difference was the ability to keep converting at the back end.
The counterexample is just as important. India’s 101 in 2016 came with only 40 powerplay runs and 40 in the middle overs, before Sri Lanka completed a modest chase. The 2012 chase demonstrates another route: India reached 158/5 in 17.5 overs after England’s 157/6, so a side can chase successfully without needing a 200-plus target. The average gap between first and second innings (169.20 versus 148.40) reflects wickets, game state and chase quality, not fixed deterioration.
The leading individual sample run-scorer is Axar Patel with 70, including the highest score, 65, in the 2023 match. Dasun Shanaka has 68, Hardik Pandya 67, and Shikhar Dhawan 61. The spread is a reminder that Pune’s run-makers are not confined to specialist openers: an all-rounder who bats with intent can dominate a short venue sample.
Batters should value a stable base and access to the straight boundary, then preserve enough wickets for overs 16–20. The phase totals show why: first innings produced 256 powerplay runs, 317 in the middle and 273 at the death. The middle phase was the largest aggregate segment, but the death overs were still highly productive when wickets were available. In a chase, middle overs supplied 390 runs across the sample, while death overs produced 136; several chases were either won early or lost momentum after wickets fell.
Pace, spin and phase match-ups
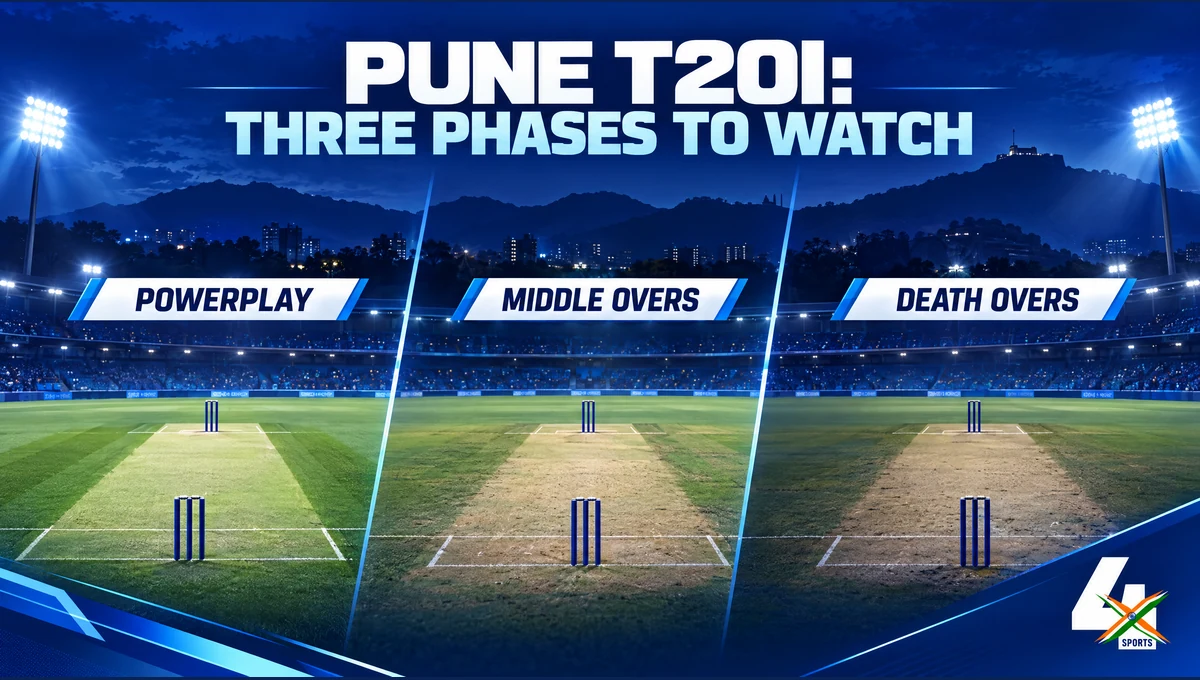
Pace took 51 of the 68 credited wickets in the five matches, compared with 17 for spin under the Cricsheet-based classification. That makes seam the primary wicket-taking method overall, not evidence that every ball is a fast-bowler’s ball. Pace claimed 17 wickets in powerplays, 18 in middle overs and 16 at the death. New-ball movement, hard lengths and changes of pace all have a role, particularly against batters trying to force the rate.
Spin’s 17 wickets are concentrated in the middle: only two in the powerplay, 13 in overs 7–15, and two at the death. That pattern is the clearest tactical signal in the data. Once fielding restrictions lift, a spinner who varies pace and attacks the stumps can interrupt the set batter’s rhythm. The middle-overs spin returns also explain why Pune should not be reduced to a small-boundary batting venue. Batters who sweep or attack spin need a plan for the longer consequence of a mistimed shot, while captains can use a spinner before the final five overs rather than saving every over for the end.
The phase-run totals also show contrasting match shapes. First innings averaged 51.2 powerplay runs, 63.4 middle-overs runs and 54.6 death-overs runs. Second innings averaged 43.2, 78.0 and 27.2 respectively. The second-innings middle surge is consistent with successful chases gaining control between overs 7 and 15, while the lower death aggregate reflects wickets, completed chases and innings that ended before the final overs. These are match-shape descriptors from delivery data, not proof that the pitch itself changes in a single direction.
The five actual scorecards, 2012–2025
- India vs England, 20 December 2012: England made 157/6 and India chased 158/5 in 17.5 overs. Alex Hales scored 56; Yuvraj Singh took 3/19. Scorecard
- India vs Sri Lanka, 9 February 2016: India were dismissed for 101, and Sri Lanka reached 105/5 in 18 overs. Kasun Rajitha returned 3/29. Scorecard
- India vs Sri Lanka, 10 January 2020: India posted 201/6, led by KL Rahul’s 54 and Shikhar Dhawan’s 52, then dismissed Sri Lanka for 123. Scorecard
- Sri Lanka vs India, 5 January 2023: Sri Lanka’s 206/6 beat India’s 190/8. Axar Patel made 65, Kusal Mendis 52 and Dasun Shanaka 56 not out. Scorecard
- India vs England, 31 January 2025: India scored 181/9 and won by 15 runs after England made 166 all out. Shivam Dube and Hardik Pandya made 53; Ravi Bishnoi, Harshit Rana and Saqib Mahmood each took three wickets. Scorecard
Top 10 Pune men’s T20I batters in the verified sample
ESPNcricinfo’s ground batting record and the five-scorecard sample provide the following player table. Matches are appearances at the ground; innings and dismissals are included so the average can be read in context. This is a men’s T20I table, not an IPL or domestic record.
| # | Batter | Country | Mat | Runs | 50s | 100s | HS | Avg | Inns | Dismissals |
|---|---|---|---|---|---|---|---|---|---|---|
| 1 | Axar Patel | India | 2 | 70 | 1 | 0 | 65 | 35.00 | 2 | 2 |
| 2 | Dasun Shanaka | Sri Lanka | 3 | 68 | 1 | 0 | 56 | 34.00 | 3 | 2 |
| 3 | Hardik Pandya | India | 3 | 67 | 1 | 0 | 53 | 22.33 | 3 | 3 |
| 4 | Shikhar Dhawan | India | 2 | 61 | 1 | 0 | 52 | 30.50 | 2 | 2 |
| 5 | Dhananjaya de Silva | Sri Lanka | 2 | 60 | 1 | 0 | 57 | 30.00 | 2 | 2 |
| 6 | Alex Hales | England | 1 | 56 | 1 | 0 | 56 | 56.00 | 1 | 1 |
| 7 | KL Rahul | India | 1 | 54 | 1 | 0 | 54 | 54.00 | 1 | 1 |
| 8 | Shivam Dube | India | 1 | 53 | 1 | 0 | 53 | 53.00 | 1 | 1 |
| 9 | Kusal Mendis | Sri Lanka | 1 | 52 | 1 | 0 | 52 | 52.00 | 1 | 1 |
| 10 | Harry Brook | England | 1 | 51 | 1 | 0 | 51 | 51.00 | 1 | 1 |
Top 10 Pune men’s T20I bowlers in the verified sample
The corrected bowling order follows the ESPNcricinfo exact-ground wickets leaderboard. Matches mean appearances at the ground, not only matches in which a player bowled. Economy is runs conceded per six legal balls; strike rate is legal balls per wicket. The table deliberately ends at these ten names and does not include Umran Malik, who is outside the requested top ten.
| # | Bowler | Country | Mat | Wkts | Econ | Avg | SR | BBI | Legal balls | Runs conceded |
|---|---|---|---|---|---|---|---|---|---|---|
| 1 | Dasun Shanaka | Sri Lanka | 3 | 5 | 5.00 | 4.00 | 4.80 | 3/16 | 24 | 20 |
| 2 | Kasun Rajitha | Sri Lanka | 2 | 5 | 6.37 | 10.20 | 9.60 | 3/29 | 48 | 51 |
| 3 | Yuvraj Singh | India | 2 | 3 | 4.75 | 6.33 | 8.00 | 3/19 | 24 | 19 |
| 4 | Ravichandran Ashwin | India | 2 | 3 | 6.57 | 15.33 | 14.00 | 2/13 | 42 | 46 |
| 5 | Ravi Bishnoi | India | 1 | 3 | 7.00 | 9.33 | 8.00 | 3/28 | 24 | 28 |
| 6 | Axar Patel | India | 2 | 3 | 7.14 | 16.66 | 14.00 | 2/24 | 42 | 50 |
| 7 | Navdeep Saini | India | 1 | 3 | 7.30 | 9.33 | 7.66 | 3/28 | 23 | 28 |
| 8 | Harshit Rana | India | 1 | 3 | 8.25 | 11.00 | 8.00 | 3/33 | 24 | 33 |
| 9 | Saqib Mahmood | England | 1 | 3 | 8.75 | 11.66 | 8.00 | 3/35 | 24 | 35 |
| 10 | Lakshan Sandakan | Sri Lanka | 1 | 3 | 8.75 | 11.66 | 8.00 | 3/35 | 24 | 35 |
Pune men’s T20I records and FAQs
What is the highest team total at Pune?
Sri Lanka’s 206/6 against India on 5 January 2023 is the highest team total in the five verified men’s T20Is.
What is the lowest total?
India’s 101 all out against Sri Lanka on 9 February 2016 is the lowest. It is a warning against assuming that Pune always produces a high-scoring contest.
Is Pune batting friendly?
It is capable of being batting-friendly, but the evidence supports a variable, situation-sensitive surface rather than a universal label. The same five-match sample includes 201/6 and 206/6, plus 101 all out. Teams batting first have won three of five, so a big total can matter, but a disciplined chase has also succeeded twice.
Are spinners important at Pune?
Yes, especially in the middle overs. The delivery sample assigns spin 13 wickets in overs 7–15, compared with two in the powerplay and two at the death. Pace still leads overall with 51 credited wickets, but middle-overs spin is a meaningful tactical channel.
Who has the highest individual score?
Axar Patel’s 65 against Sri Lanka on 5 January 2023 is the highest individual score in this sample.
Is chasing easy at the venue?
Not automatically. Chasing succeeded twice: India made 158/5 in 2012 and Sri Lanka made 105/5 in 2016. The other three matches were won by teams batting first, including the 2023 and 2025 contests.
What are the average scores?
The average first-innings score is 169.20, and the average second-innings score is 148.40, calculated from exactly five completed men’s T20Is at the historical Pune ground.
Which sources underpin this pitch report?
The match results and player leaderboards come from ESPNcricinfo’s ground records. Delivery-level phase totals and wicket classifications were checked with the official Cricsheet T20 JSON archive. Schedule details come from BCCI, ICC and ESPNcricinfo. The historical sample is limited to men’s T20Is at this exact-ground record and should not be mixed with other formats or competitions.
More in this series: six-match tour schedule, Delhi Odi report, Bengaluru Odi report.
