

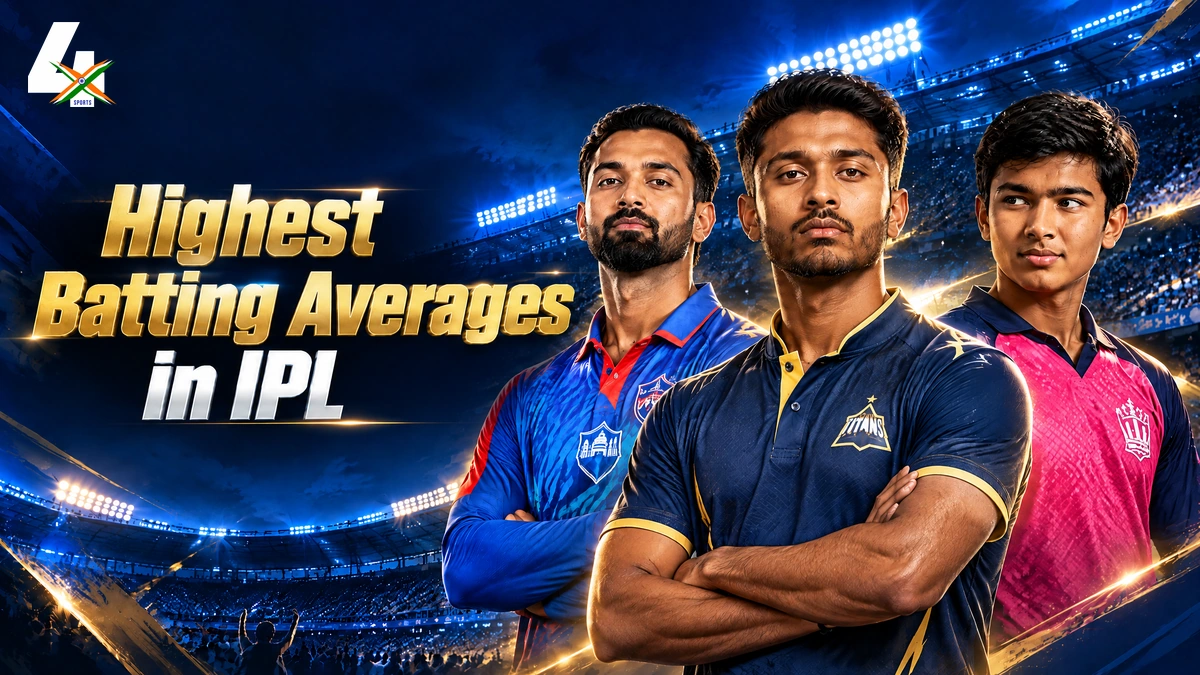
Sai Sudharsan has the highest IPL career batting average among players with at least 1,000 IPL runs. The Gujarat Titans batter is listed at 48.36, with 2,515 runs in 57 innings and five not-outs through the completed 2026 season.
KL Rahul is second at 46.15, while Vaibhav Sooryavanshi is third at 44.69. This list uses a 1,000-run minimum, so short careers with eye-catching averages do not qualify.
| Rank | Player | Average | Innings | Not Outs | Runs |
|---|---|---|---|---|---|
| 1 |
Sai SudharsanGT
|
48.36 | 57 | 5 | 2,515 |
| 2 |
KL RahulRCB, SRH, Kings XI Punjab, LSG, DC
|
46.15 | 150 | 24 | 5,815 |
| 3 |
Vaibhav SooryavanshiRR
|
44.69 | 23 | 0 | 1,028 |
| 4 |
Devon ConwayCSK
|
43.20 | 28 | 3 | 1,080 |
| 5 |
Heinrich KlaasenRR, RCB, SRH
|
42.08 | 60 | 10 | 2,104 |
| 6 |
David WarnerDelhi Daredevils, SRH
|
40.52 | 184 | 22 | 6,565 |
| 7 |
Virat KohliRCB
|
40.41 | 275 | 44 | 9,336 |
| 8 |
Shubman GillKKR, GT
|
40.33 | 131 | 17 | 4,598 |
| 9 |
Lendl SimmonsMI
|
39.96 | 29 | 2 | 1,079 |
| 10 |
Shaun MarshKings XI Punjab
|
39.95 | 69 | 7 | 2,477 |
Scope and cutoff: IPL matches only. Figures are checked through the completed IPL 2026 season on 31 May 2026. Batting average here means runs divided by dismissals: innings minus not-outs. Ranks are ordered by the reported career average after the 1,000-run filter.
What the IPL Batting Average Record Means
A batting average measures how many runs a batter scores per dismissal. It is not calculated from matches or from total innings alone. For example, Sai Sudharsan’s 2,515 runs came in 57 innings with five not-outs, leaving 52 dismissals. The figure is displayed as 48.36 in the table, using truncated two-decimal precision.
The 1,000-run cutoff is important. It gives the table enough career volume to compare established IPL batters with emerging players. It also prevents a handful of early unbeaten innings from deciding an all-time career list.
Who Leads the Qualified List?
Sai Sudharsan leads after a rapid rise with Gujarat Titans. KL Rahul follows with 5,815 runs and 24 not-outs across 150 innings. The gap between them is 2.21 average points on the displayed figures.
Vaibhav Sooryavanshi is the youngest name in the top three and has already crossed the qualification line with 1,028 runs. Devon Conway and Heinrich Klaasen complete the next two places. The rest of the top ten includes long-career run makers David Warner, Virat Kohli, Shubman Gill, Lendl Simmons and Shaun Marsh.
Why Not-Outs Change the Ranking
Not-outs reduce the number of dismissals. That can lift a player’s average even when two batters have similar run totals. The table therefore shows innings and not-outs alongside runs, making the calculation visible rather than treating average as a standalone score.
This record is different from strike rate. Strike rate measures runs per 100 balls, while average measures runs per dismissal. A batter can rank highly in one and not the other.
Qualification and Displayed Precision
Players need at least 1,000 IPL career runs to qualify. The underlying runs, innings and not-outs are shown alongside the average. Some statistics services round a final decimal differently; this table uses one consistent displayed-precision basis without changing the ranking.
FAQs
Who Has the Highest Batting Average in IPL History?
Sai Sudharsan leads this qualified list at 48.36, with a minimum requirement of 1,000 IPL career runs.
How Is IPL Batting Average Calculated?
Divide IPL runs by dismissals. Dismissals equal batting innings minus not-out innings.
Why Is the 1,000-Run Minimum Used?
It adds a meaningful career-volume test and prevents very short careers from dominating the ranking.
Is Batting Average the Same as Strike Rate?
No. Average is runs per dismissal. Strike rate is runs scored per 100 balls faced.
