

Introduction
This Ranchi T20I pitch report looks at the JSCA ground for India vs West Indies.
JSCA International Stadium Complex is in Ranchi, Jharkhand, India. It is a key India cricket ground. It has hosted four completed men’s T20Is through 2 October 2026. The set is small. It has seen 196/6, a 155/3 chase and a 176/6 total.
India will play West Indies in the 2nd T20I on 9 October 2026. The game starts at 7:00 PM IST. The ESPNcricinfo fixture names JSCA International Stadium Complex. The BCCI schedule backs the date, city and start time.
Ranchi has seen quick starts. It has also seen hard chases. Top-order runs have helped. Wickets in overs 7–15 have also changed games. This report uses only men’s T20Is at this ground. For team news, see our India–West Indies squad update.
On This Page
Match Schedule
| Match | Series | Date | Time | Format |
|---|---|---|---|---|
| India Vs West Indies, 2nd T20I | West Indies Tour Of India 2026/27 | Friday, 9 October 2026 | 7:00 PM IST | Men’s T20I |
This is a night game. The local hours are 7:00 PM to 10:20 PM. The break runs from 8:30 PM to 8:50 PM. These times come from the ESPNcricinfo match page.
Ranchi T20I Pitch Report
The four-match record gives no one clear label. India made 196/6 in 2016. New Zealand made 176/6 in 2023. Sri Lanka made 127/9 in 2016. India made 155/9 while chasing 177 in 2023.
Match state is the best guide. India’s 155/3 against New Zealand in 2021 is the only chase above 150 that won. The 2017 Australia match was cut by rain. It used the DLS method. It is not a normal 20-over guide.
A fair view is batting value with a clear reward for control. Teams that kept wickets and scored in the middle overs did well. Spin and tight pace also took key wickets.
The record does not set a par score. It does not show one fixed pitch type. The sample is small. A strong first six overs can lift a score. A cluster of wickets can cut it down.
Ground T20I Statistics
The Howstat ground summary and its exact-ground match list show four completed men’s T20Is at JSCA International Stadium Complex.
Howstat may show the alternate name HEC International Cricket Stadium. These figures use only GroundCode=223 for the exact Ranchi ground. Hyderabad and Dehradun name matches were not used.
| Statistic | Record | Note |
|---|---|---|
| Total Completed Men’s T20Is | 4 | 12 February 2016 to 27 January 2023 |
| Mean First-Innings Score | 160.75 | 643 runs from 4 innings |
| Mean Second-Innings Score | 121.50 | 486 runs from 4 innings |
| Mean First-Innings Score, Rain/DLS Match Removed | 175.00 | 525 runs from 3 matches |
| Mean Second-Innings Score, Rain/DLS Match Removed | 145.67 | 437 runs from 3 matches |
| Highest Team Total | 196/6, India | Vs Sri Lanka, 2016 |
| Lowest Scorecard Total | 49/1, India | Revised DLS chase, 2017 |
| Lowest Full-Length Completed Innings | 127/9, Sri Lanka | Vs India, 2016 |
| Highest Successful Chase | 155/3, India | Vs New Zealand, 2021 |
| Wins Batting First | 2 | 50% |
| Wins Batting Second | 2 | 50% |
| Ties | 0 | No tied match found |
| No Results | 0 | No abandoned result found |
The raw means include the 2017 game. Australia made 118/8 in 18.4 overs. Rain then set India 48 runs from six overs. India made 49/1 in 5.3 overs. The rain-free means give a fairer view of full 20-over games.
The two mean sets use two samples. Raw means cover all four completed games. The other set covers three full games. The sets must not be mixed.
Detailed Pitch Behaviour
Batting Conditions
The ground has seen two totals above 175 in four games. India made 196/6 in 2016. That score came from a strong powerplay and a late surge. New Zealand made 176/6 in 2023. Devon Conway made 52. Daryl Mitchell made 59 not out.
KL Rahul has the top score here. He made 65 in 2021. No men’s T20I hundred has been scored here. The figures show good scoring. They do not promise a big score each time.
Batters have room to score. The ground has not shown high scores in each game. A sound start helps. Wicket loss can slow an innings. Care first, then late-overs attack, is the clear score pattern.
Fast Bowling
Fast bowlers have taken key wickets here. Jasprit Bumrah took 2/17 in 2016. He took 2/17 again in 2017. Tim Southee took 3/16 in the 2021 chase. Lockie Ferguson took 2/33 in 2023. New Zealand defended 176 in that game.
The cards show value in new-ball and late-innings bowling. They do not prove a set level of seam or bounce. Pace changes and good lines have worked when they forced errors.
Control may matter more than raw pace. A bowler who holds a line can force a risky shot. The sample is too small to say that every game will aid seam bowling.
Spin Bowling
Spin has a strong record in this small set. Ravichandran Ashwin took 3/14 in 2016. Kuldeep Yadav took 2/16 in the rain-shortened 2017 game. He took 2/20 in 2023. Mitchell Santner took 2/11 in 2023.
These figures show a role for spin in overs 7–15. Spinners can cut runs. They can also break a stand. The ground record backs a mixed attack. It is not a spin-only ground.
Spin can work when batters try to lift the rate. It can test a new batter after a wicket. Both pace and spin have worked here. The past does not prove one plan for each game.
Phase-Wise Pitch Behaviour
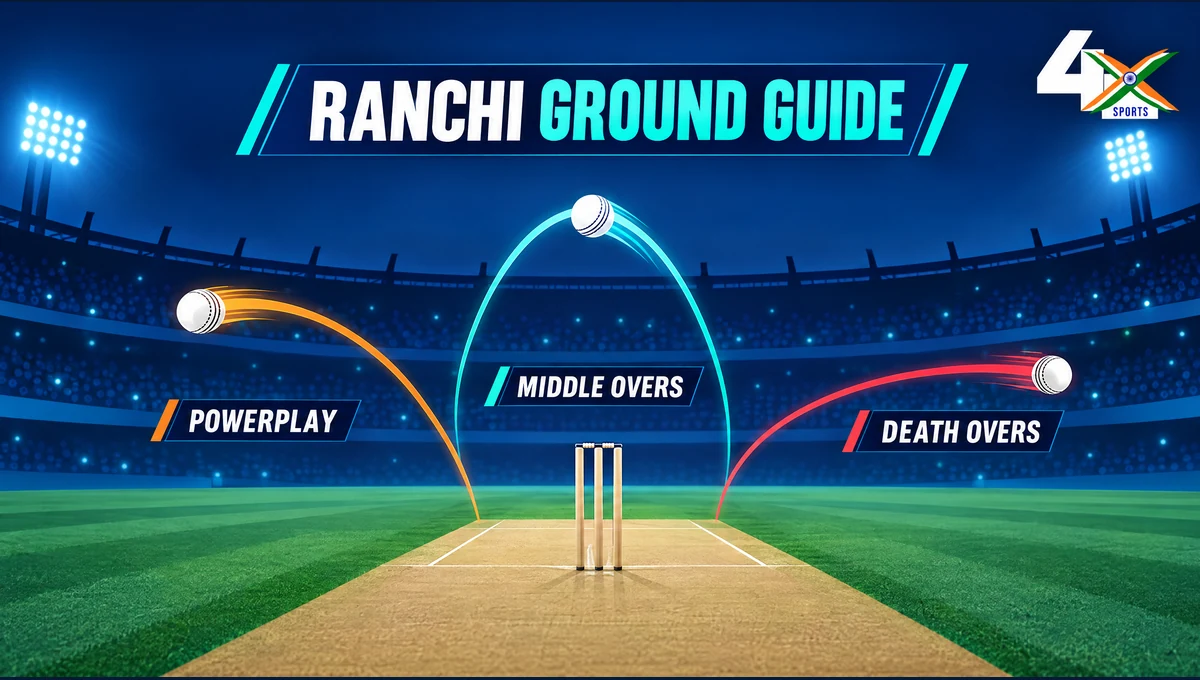
The phase bands are powerplay overs 1–6, middle overs 7–15 and final overs 16–20. The rates use runs divided by recorded balls, then times six. The 2017 rain/DLS game is out. The set has three full games. It is not a forecast for each game.
| Innings Order | Powerplay Overs 1–6 | Middle Overs 7–15 | Final Overs 16–20 |
|---|---|---|---|
| First Innings | 181 runs, 9.61 per over | 192 runs, 6.90 per over | 152 runs, 9.40 per over |
| Second Innings | 115 runs, 6.11 per over | 231 runs, 8.35 per over | 91 runs, 6.91 per over |
First innings scored fastest in the powerplay and final phase. Chases scored faster in overs 7–15. Middle-phase wickets are thus a key trend.
These phase totals are sample totals. They are not pitch laws. They come from three full games. They show how those innings moved. They do not set the rate for the next game.
Recent T20I Trends
The 2016 India Vs Sri Lanka scorecard shows the clearest high score. India made 196/6. Shikhar Dhawan hit 51 from 25 balls. India won by 69 runs. Sri Lanka made 127/9. Ashwin took 3/14.
The 2017 India Vs Australia scorecard is a special case. Australia made 118/8 in 18.4 overs. Rain cut the chase to 48 from six overs. India made 49/1 in 5.3 overs. India won by nine wickets under DLS. It is an official completed match. It is not a normal 20-over guide.
The 2021 India Vs New Zealand scorecard shows the best chase. New Zealand made 153/6. India reached 155/3 in 17.2 overs. KL Rahul made 65. Rohit Sharma made 55. Southee took 3/16. India’s middle phase was strong enough to end the chase.
The 2023 India Vs New Zealand scorecard shows the cost of early wickets. New Zealand made 176/6. Conway scored 52. Mitchell hit 59 not out from 30 balls. India lost early wickets. It made 155/9. Santner, Bracewell and Ferguson took two wickets each.
The recent trend is fair and mixed. A score near 155 was chased once. It was also defended once. New Zealand’s 176 was enough in 2023. India lost early wickets then. The data supports a flexible plan. It does not set a par score.
The four games use more than one sample. Four completed games form the ground record. Three full games form the phase set. The rain game stays in the full record. It is out of like-for-like phase rates.
Top Batters
This is the exact-ground men’s T20I run table from the Howstat batting table. ESPNcricinfo’s Ranchi T20I ground records were also checked. Matches means matches played at this ground. Average follows the Howstat table. It uses dismissed innings as the denominator.
| Player | Country | Matches | Runs | 50s | 100s | Highest Score | Average |
|---|---|---|---|---|---|---|---|
| Rohit Sharma | India | 3 | 109 | 1 | 0 | 55 | 36.33 |
| Daryl Mitchell | New Zealand | 2 | 90 | 1 | 0 | 59* | 90.00 |
| Shikhar Dhawan | India | 2 | 66 | 1 | 0 | 51 | 66.00 |
| KL Rahul | India | 1 | 65 | 1 | 0 | 65 | 65.00 |
| Devon Conway | New Zealand | 1 | 52 | 1 | 0 | 52 | 52.00 |
| Glenn Phillips | New Zealand | 2 | 51 | 0 | 0 | 34 | 25.50 |
| Washington Sundar | India | 1 | 50 | 1 | 0 | 50 | 50.00 |
| Hardik Pandya | India | 3 | 48 | 0 | 0 | 27 | 24.00 |
| Suryakumar Yadav | India | 2 | 48 | 0 | 0 | 47 | 24.00 |
| Aaron Finch | Australia | 1 | 42 | 0 | 0 | 42 | 42.00 |
The asterisk marks an unbeaten top score. These are venue figures. They are not career figures. The sample is small. Some averages use one or two dismissed innings.
The table ranks runs at this ground. It does not rank a full T20I record. Matches means venue appearances. This matters when a player has played many games elsewhere.
Top Bowlers
This is the exact-ground men’s T20I wicket table from the Howstat bowling table. Economy is runs per six legal balls. Bowling average is runs per wicket. Strike rate is legal balls per wicket.
| Player | Country | Matches | Wickets | Economy | Average | Strike Rate | BBI |
|---|---|---|---|---|---|---|---|
| Jasprit Bumrah | India | 2 | 4 | 5.67 | 8.50 | 9.00 | 2/17 |
| Ravichandran Ashwin | India | 2 | 4 | 4.13 | 8.25 | 12.00 | 3/14 |
| Kuldeep Yadav | India | 2 | 3 | 4.50 | 12.00 | 16.00 | 2/16 |
| Thisara Perera | Sri Lanka | 1 | 3 | 11.00 | 11.00 | 6.00 | 3/33 |
| Tim Southee | New Zealand | 1 | 3 | 4.00 | 5.33 | 8.00 | 3/16 |
| Ashish Nehra | India | 1 | 2 | 8.67 | 13.00 | 9.00 | 2/26 |
| Bhuvneshwar Kumar | India | 2 | 2 | 8.74 | 33.50 | 23.00 | 1/28 |
| Harshal Patel | India | 1 | 2 | 6.25 | 12.50 | 12.00 | 2/25 |
| Lockie Ferguson | New Zealand | 1 | 2 | 8.25 | 16.50 | 12.00 | 2/33 |
| Michael Bracewell | New Zealand | 1 | 2 | 7.75 | 15.50 | 12.00 | 2/31 |
Jasprit Bumrah and Ravichandran Ashwin share the wicket lead. Each has four. Southee has the best bowling average in this top-ten group. Ashwin has the best economy.
These figures are for this ground only. Economy, average and strike rate use the legal-ball rules in the Howstat table. This is not a career list.
Upcoming Matches
The BCCI fixture notice lists one upcoming match at this ground in the checked schedule.
| Date | Match | Series | Format | Time |
|---|---|---|---|---|
| 9 October 2026 | India Vs West Indies, 2nd T20I | West Indies Tour Of India 2026/27 | Men’s T20I | 7:00 PM IST |
This fixture table is separate from the old leaderboards. The listed India squad is not a predicted XI.
Key Ground Records
- Most men’s T20I runs: Rohit Sharma, 109 runs in 3 matches.
- Highest individual score: KL Rahul, 65, against New Zealand on 19 November 2021.
- Most men’s T20I wickets: Jasprit Bumrah and Ravichandran Ashwin, 4 each.
- Best bowling figures: Ravichandran Ashwin, 3/14 against Sri Lanka on 12 February 2016.
- Highest team total: India’s 196/6 against Sri Lanka in 2016.
- Highest successful chase: India’s 155/3 against New Zealand in 2021.
- Most centuries at the ground: 0 in completed men’s T20Is through 2 October 2026.
- Result split: 2 wins batting first and 2 wins batting second.
FAQs
Is JSCA International Stadium Complex Batting-Friendly?
It has produced good totals. The record is still mixed. The normal-length first-innings mean is 175.00 from three games. India made 196/6 in 2016. India made 155/9 in a 2023 chase of 177. The safest label is a scoring ground where wickets still matter.
Are Spinners Important At JSCA International Stadium Complex?
Yes. Ashwin took 3/14 in 2016. Kuldeep took 2/16 in 2017. He took 2/20 in 2023. The phase data shows that middle overs matter. Spin can help control that part of an innings.
What Is The Highest Men’s T20I Team Score At The Ground?
India’s 196/6 against Sri Lanka on 12 February 2016 is the top men’s T20I team total listed for JSCA International Stadium Complex.
Who Has Scored The Most Men’s T20I Runs At The Ground?
Rohit Sharma leads the exact-ground table. He has 109 runs in three games. The figure is for this ground only.
Who Has Taken The Most Men’s T20I Wickets At The Ground?
Jasprit Bumrah and Ravichandran Ashwin share the lead. Each has four wickets. Ashwin’s best figures are 3/14. Bumrah’s best are 2/17.
What Is The Average Men’s T20I Score At Ranchi?
The raw mean first-innings score is 160.75 from four innings. It is 175.00 from three full games after the 2017 rain/DLS game is removed. The raw second-innings mean is 121.50 from four innings. It is 145.67 from the three full games.
