

Last updated: 24 August 2026, based on the latest standings displayed by the International Cricket Council. The table should be refreshed after every completed Test, points deduction, or official correction.
The WTC points table shows the latest standings in the ICC World Test Championship 2025–27 cycle. It tracks Tests played, wins, losses, draws, points deductions, total points, and Points Percentage (PCT). This WTC points table 2027 guide also explains the latest qualification race, WTC points table scenarios, and the confirmed details of the WTC Final 2027.
Unlike a conventional league table, the World Test Championship ranks teams by PCT rather than total points alone. This is important because teams play different numbers of Tests during the cycle. The top two teams at the end of the championship qualify for the WTC Final 2027, where the winner will lift the WTC trophy.
Table of Contents
WTC Points Table 2027
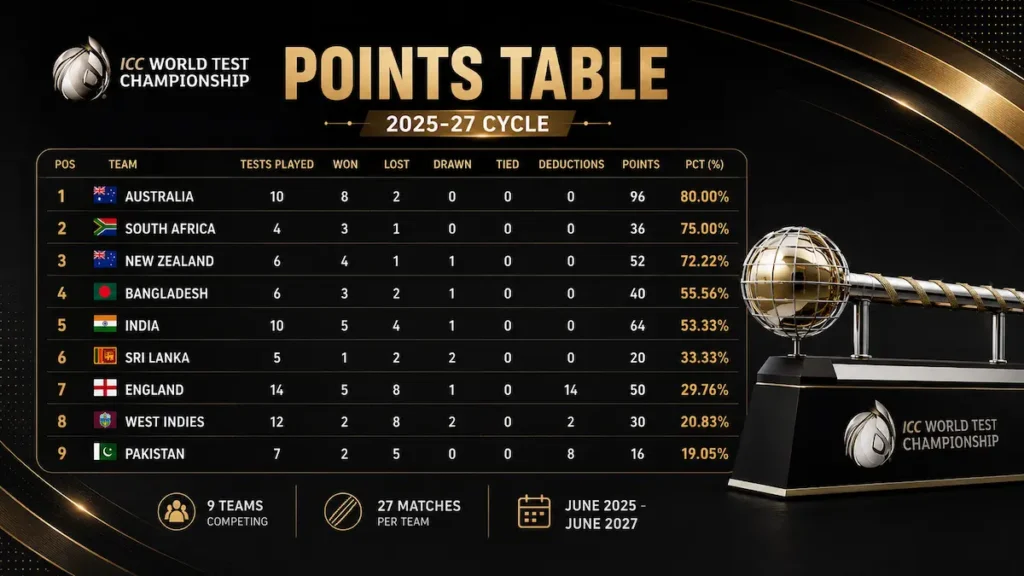
| Pos | Team | Tests Played | Won | Lost | Drawn | Tied | Deductions | Points | PCT |
|---|---|---|---|---|---|---|---|---|---|
| 1 | Australia | 10 | 8 | 2 | 0 | 0 | 0 | 96 | 80.00% |
| 2 | South Africa | 4 | 3 | 1 | 0 | 0 | 0 | 36 | 75.00% |
| 3 | New Zealand | 6 | 4 | 1 | 1 | 0 | 0 | 52 | 72.22% |
| 4 | Bangladesh | 6 | 3 | 2 | 1 | 0 | 0 | 40 | 55.56% |
| 5 | India | 10 | 5 | 4 | 1 | 0 | 0 | 64 | 53.33% |
| 6 | Sri Lanka | 5 | 1 | 2 | 2 | 0 | 0 | 20 | 33.33% |
| 7 | England | 14 | 5 | 8 | 1 | 0 | 14 | 50 | 29.76% |
| 8 | West Indies | 12 | 2 | 8 | 2 | 0 | 2 | 30 | 20.83% |
| 9 | Pakistan | 7 | 2 | 5 | 0 | 0 | 8 | 16 | 19.05% |
Table source: ICC World Test Championship standings.
Australia currently lead the WTC points table with a PCT of 80.00%, followed by South Africa on 75.00% and New Zealand on 72.22%. Bangladesh and India occupy fourth and fifth place respectively, while Sri Lanka, England, West Indies, and Pakistan are outside the top four in the latest table.
The table is not final. The WTC 2025–27 cycle continues until the final standings are established, and every result can change the order. Readers should check the update time above before using the figures for qualification discussions.
Who is Leading the WTC Points Table?
Australia currently lead the WTC points table with an 80.00% PCT, followed by South Africa on 75.00% and New Zealand on 72.22%. Bangladesh and India are the next two teams in the current standings, but the qualification race remains open while the WTC 2025–27 cycle continues.
The most important part of this page is the live table at the top. Readers should use the scenario analysis as a guide to possible qualification routes, not as a guarantee. Every completed Test can change the PCT, the order of the teams, and the route to the WTC Final 2027.
What is the Latest WTC Points Table Update?
Australia remain in first place after winning eight of their ten completed Tests. South Africa are second with three wins from four Tests, while New Zealand are close behind after earning 72.22% of the available points from six matches.
The current table also shows why total points must be read together with PCT. New Zealand have 52 points, more than South Africa’s 36, but South Africa are second because they have earned a higher percentage from the Tests they have played. Similarly, deductions can affect a team’s position even when its match record appears competitive.
England have 14 points deducted in the current official table, while West Indies and Pakistan have also recorded deductions. These sanctions are shown separately so that readers can distinguish points won through match results from points removed under the competition rules.
How the WTC Points System Works
The World Test Championship awards points for every Test match, but teams do not all play the same number of matches. The ICC therefore uses Points Percentage to rank the teams rather than simply ordering them by total points.
| Test Result | Points Awarded | Explanation |
|---|---|---|
| Win | 12 points to the winner | The winning team receives all available points for the Test. |
| Tie | 6 points to each team | Each team receives half of the available points. |
| Draw | 4 points to each team | Each team receives the points allocated for a drawn Test. |
| Loss | 0 points | The losing team earns no match points. |
| Official deduction | Deduction as imposed | A sanction, such as a slow-over-rate penalty, can reduce a team’s total. |
The Basic PCT Formula is: PCT = Points Won ÷ Points Available × 100
For example, a team that earns 96 points from 120 available points has a PCT of 80.00%. The official standings should always be treated as the final authority because deductions, match status, and competition rules can affect the displayed calculation.
Why PCT Matters More Than Total Points
Total points alone do not provide a fair comparison when teams have played different numbers of Tests. A team with fewer matches may have a higher PCT and a lower total points tally than a team that has played more Tests.
For this reason, the most important columns in the WTC points table are PCT, matches played, points, and deductions. Wins and losses explain the record, while draws and ties show how the team earned its points. The PCT column determines the ranking shown in the official table.
Are Net Run Rate and Head-to-Head Results Used?
Net run rate should not be used as the primary ranking metric for the WTC points table. NRR is commonly associated with limited-overs competitions, whereas the WTC standings use PCT. Do not transfer a T20 or ODI points-table template directly into a WTC article.
If two teams are close in PCT, the article should refer to the official ICC competition regulations rather than inventing a tie-break rule. Any deductions or official corrections should be shown exactly as reported by the ICC.
WTC Points Table Scenarios: What Each Team Needs to Reach the Final
The WTC points table scenarios change after every Test. A team’s qualification prospects depend on its current PCT, remaining matches, maximum available points, future results, deductions, and the results of its main rivals.
There is no permanent qualifying PCT that guarantees a place in every WTC Final. The effective cut-off depends on the final results across the entire cycle. Therefore, scenario articles should use phrases such as “projected route,” “current target,” and “likely qualification mark,” rather than presenting an estimated number as an official rule.
Australia Qualification Scenario
Australia are currently first with an 80.00% PCT and eight wins from ten Tests. Their position gives them the strongest starting point in the current WTC points table, but first place is not the same as confirmed qualification.
Australia’s route is straightforward: continue collecting wins and avoid a sequence of defeats that allows South Africa or New Zealand to overtake them. Because PCT is calculated against points available, Australia must evaluate every remaining Test rather than relying on its current total of 96 points.
The main risks are losses in high-value remaining series, deductions, and a strong finish from the teams immediately below them. The article should update this subsection whenever Australia complete another Test.
South Africa Qualification Scenario
South Africa sit second with a 75.00% PCT after four Tests. Their current position places them inside the qualification zone, but they have played fewer matches than several other contenders.
South Africa can strengthen their route to the WTC Final by maintaining a high rate of wins in their remaining fixtures. Draws provide points but can reduce the pace at which a team improves its PCT compared with a win. A poor run could bring New Zealand or another contender into the qualification battle.
The key information to update here is South Africa’s remaining schedule, the maximum points still available, and the projected PCT under win, draw, and loss scenarios.
New Zealand Qualification Scenario
New Zealand are third with a 72.22% PCT and remain close to the top two. Their position makes them one of the most important teams to monitor in the WTC points table scenarios section.
New Zealand need to convert their strong current PCT into enough points across the rest of the cycle. Winning direct or strategically important series would improve their position, while drawn or lost Tests could allow South Africa to pull away or give the teams below an opportunity to close the gap.
A strong update should show whether New Zealand can qualify with a specific combination of wins and draws based on the verified remaining schedule. Those calculations must be refreshed after each completed Test.
Bangladesh Qualification Scenario
Bangladesh are fourth with a 55.56% PCT. They currently occupy the final position in the top-two race only in the broad standings sense, because just the top two teams qualify for the WTC Final 2027.
Bangladesh need a sustained run of positive results and will also depend on the teams above them dropping points. Their scenario is more sensitive to away results, deductions, and the number of Tests remaining than the scenarios of the current top three.
A useful update should compare Bangladesh’s projected maximum PCT with the likely finishing ranges of South Africa and New Zealand. It should also explain which rival results would help Bangladesh move into the top two.
India Qualification Scenario
India are fifth with a 53.33% PCT after ten Tests. They remain behind Bangladesh in the current table and must improve both their own results and their position relative to the leading contenders.
India’s qualification route requires a strong finish. Wins would provide the greatest improvement, while draws would add points but may not be enough if South Africa and New Zealand continue winning. India’s remaining schedule should be listed alongside a clearly labelled calculation showing the effect of possible results.
Avoid publishing a fixed statement such as “India must win exactly seven Tests” unless the calculation has been made from the latest official schedule and current standings. The number can change after every result, deduction, or schedule revision.
Sri Lanka Qualification Scenario
Sri Lanka are sixth with a 33.33% PCT after five Tests. They are outside the current qualification positions and need a major improvement in results to re-enter the race.
Their scenario should be described as difficult rather than mathematically impossible unless the official schedule and remaining points confirm elimination. A sequence of wins can improve PCT quickly, but Sri Lanka also need several results involving higher-ranked contenders to go in their favour.
England, West Indies, and Pakistan Qualification Scenario
England, West Indies, and Pakistan occupy the bottom three positions in the latest table. England’s PCT is 29.76% after 14 Tests, West Indies are on 20.83%, and Pakistan are on 19.05%. The official table also shows deductions for all three teams, with England recording 14 deducted points, West Indies two, and Pakistan eight.
Their routes to the WTC Final 2027 are difficult because they must improve their PCT while relying on several results elsewhere. Each team’s section should be updated with a mathematical assessment based on remaining Tests rather than described as eliminated without checking the official regulations and schedule.
How to calculate a WTC Qualification Scenario
A transparent scenario calculation makes the article more useful than a copied standings table. Begin with the team’s current points and points available. Add the points expected from the chosen future results, then divide the projected points by the projected points available.
Projected PCT = Projected Points Won ÷ Projected Points Available × 100
A simple win, draw, and loss model can be shown as follows:
| Projected Result in a Future Test | Additional Points |
|---|---|
| Win | 12 |
| Tie | 6 |
| Draw | 4 |
| Loss | 0 |
For a series of several Tests, calculate each possible result combination separately. Do not assume that a series win automatically awards a fixed number of WTC points because the number of Tests can differ between series. Also subtract any official deduction from the points total when modelling the final position.
The article should include the date and source used for every scenario calculation. A note such as “calculated from the ICC standings and published schedule on 24 August 2026” gives readers useful context and makes later revisions easier.
WTC Final 2027: Date, Venue and Qualification
The WTC Final 2027 is scheduled to take place at The Oval in London from Wednesday, 9 June to Sunday, 13 June 2027.
The final will feature the top two teams in the completed WTC 2025–27 standings. The team that finishes first is not automatically the WTC champion. Both finalists must play the title match, and the winner of that match will lift the WTC trophy.
The venue has previously hosted a WTC Final, and the ICC has confirmed England as the host country for the 2027 edition. Match timings, ticket details, broadcast information, and any reserve-day arrangements should be added only after the ICC or the relevant official authority confirms them.
What is the WTC trophy?

The WTC trophy is the championship award presented to the winner of the World Test Championship Final. The points table determines which two teams reach the Final, but it does not decide the champion by itself.
This distinction is important for readers searching for both the WTC points table and the WTC trophy. A team can lead the standings and still fail to win the title if it loses the Final. Conversely, the second-ranked finalist can become champion by winning the decisive match at The Oval.
The WTC Final is the conclusion of a two-year championship cycle in which teams accumulate points across their scheduled Test matches. The 2025–27 cycle began with Sri Lanka hosting Bangladesh in June 2025.
WTC 2025–27 Fixtures, Results, and Table Updates
| Team | Total Matches | Home | Home Match Against | Away | Away Match Against |
|---|---|---|---|---|---|
| Australia | 22 | 11 | 5- England 4- New Zealand 2- Bangladesh | 11 | 3- West Indies 3- South Africa 5- India |
| Bangladesh | 12 | 6 | 2- Pakistan 2- West Indies 2- England | 6 | 2- Sri Lanka 2- South Africa 2- Australia |
| England | 21 | 11 | 5- India 3- New Zealand 3- Pakistan | 10 | 5- Australia 3- South Africa 2- Bangladesh |
| India | 14 | 8 | 3- Australia 2- Bangladesh 3- England | 6 | 2- Pakistan 2- India 2- Sri Lanka |
| New Zealand | 16 | 11 | 5- Australia 3- South Africa 3- Bangladesh | 5 | 5- India 3- New Zealand 3- Pakistan |
| Pakistan | 16 | 7 | 3- West Indies 2- India 2- Sri Lanka | 9 | 3- England 4- Australia 2- Pakistan |
| South Africa | 13 | 6 | 2- South Africa 2- Sri Lanka 2- New Zealand | 7 | 2- Bangladesh 2- West Indies 3- England |
| Sri Lanka | 12 | 6 | 2- Pakistan 2- West Indies 2- England | 6 | 2- Bangladesh 2- South Africa 2- Australia |
| West Indies | 18 | 9 | 2- West Indies 2- South Africa 5- Australia | 9 | 5- England 2- Sri Lanka 2- New Zealand |
The WTC points table should be supported by regularly updated fixture and result sections. The standings are most useful when readers can move directly from the latest table to the match that changed it.
Latest Completed Result Affecting the Points Table
Match: [Team] vs [Team], [venue]
Result: [winner] won by [margin] / match drawn / match tied.
Points impact: [number] points added to each team under the official system.
Table impact: [team] moved from [position] to [position]; PCT changed from [old PCT] to [new PCT].
Scenario impact: [brief explanation of which qualification race changed].
Upcoming WTC Fixtures
| Date | Series | Match | Venue | Table significance |
|---|---|---|---|---|
| [Date] | [Series] | [Team] vs [Team] | [Venue] | [Why the result matters] |
This section must be updated from the official fixtures list. Remove past fixtures from the upcoming list or move them into a completed-results archive so that the page does not display stale information.
Editorial Update Policy
This WTC points table is updated after completed Tests, official points deductions, and verified corrections. Projections can change after every result because PCT depends on points won relative to points available. Readers should check the timestamp and the linked ICC standings before relying on a qualification scenario.
Frequently Asked Questions
What is the latest WTC points table?
The latest WTC points table is displayed near the top of this page. It includes each team’s Tests played, wins, losses, draws, ties, deductions, total points, and PCT. The table was last checked on 24 August 2026 against the ICC standings page.
How is the WTC points table calculated?
A team receives 12 points for a win, 6 points for a tie, and 4 points for a draw. Teams are ranked by Points Percentage, which compares points won with points available. Official deductions can reduce a team’s points and PCT.
What does PCT mean in the WTC points table?
PCT means Points Percentage. It is the percentage of available points a team has won during the WTC cycle. PCT is used because teams can play different numbers of Tests.
Who qualifies for the WTC Final 2027?
The top two teams in the completed WTC 2025–27 standings qualify for the WTC Final 2027. The final positions are not confirmed until the cycle is complete.
Where will the WTC Final 2027 be played?
The WTC Final 2027 is scheduled at The Oval in London from 9 to 13 June 2027.
Where will the WTC Final 2027 be played?
The WTC Final 2027 is scheduled at The Oval in London from 9 to 13 June 2027.
What are the latest WTC points table scenarios?
The WTC Final 2027 is scheduled at The Oval in London from 9 to 13 June 2027.
What is the WTC trophy?
The WTC trophy is the championship award presented to the winner of the World Test Championship Final. The points table selects the finalists, while the Final decides the champion.
Is NRR used in the WTC points table?
NRR should not be treated as the primary WTC ranking metric. The ICC ranks teams by PCT. A WTC article should therefore focus on PCT, points, matches played, match results, and official deductions.