First-innings totals averaged 176.46, ranging from 103–212.
13 first innings · 23 Mar 2025–18 May 2026Limited recent sample; an observation, not a par forecast.PITCH REPORT / IPL / CHEPAUK
IPL 2025–2026 · HISTORICAL
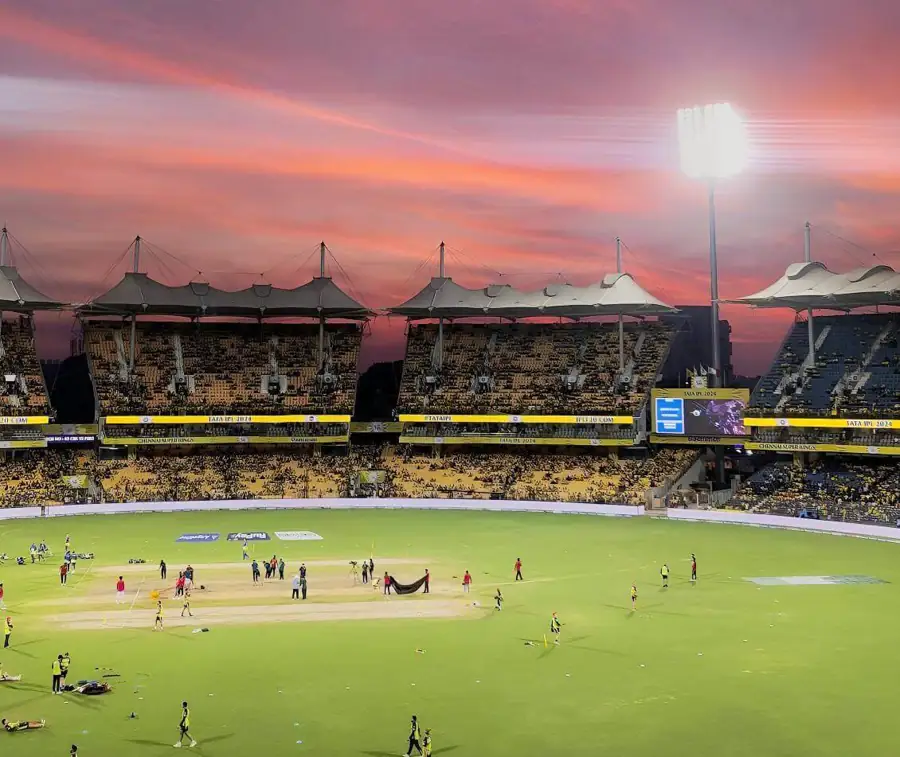
Chepauk / Chennai / IPL venue report
MA Chidambaram Stadium
IPL Pitch Report
M. A. Chidambaram Stadium · Chennai, India
HISTORICAL SAMPLE Recorded matches. No live pitch forecast.
SELECTED HISTORICAL MATCH · 18 MAY 2026
CSKCSKvsSRHSRH
180/7 (20.0) · 181/5 (19.0)
Sunrisers Hyderabad won by 5 wickets
This MA Chidambaram Stadium pitch report focuses on Indian Premier League (IPL) matches at Chepauk, Chennai. Compare average scores, batting-first vs chasing results, pace vs spin and IPL player records using the season filters below.
Selected IPL 2025–2026 sample: 13 matches · 23 Mar 2025–18 May 2026. 7/13 independent scorecard receipts; 6 archive-only records. This is not a complete all-season IPL database or today's live pitch report.
What the data tells us
Chasing teams won 9/13 (69.23%); batting first won 4/13.
13 decisive matches · 23 Mar 2025–18 May 2026Historical results, not future win probabilities.Noor Ahmad took 21 wickets in 13 bowling innings in this selection.
23 Mar 2025–18 May 2026 · ranked by credited wicketsRecent window only; not an overall MVP or future-performance prediction.13 matches · 23 Mar 2025–18 May 2026
7/13 scorecard receipts · 6 archive-only
7/13 scorecard receipts · 6 archive-only
B / Venue scoring
Chepauk IPL average score and scoring patterns
First innings and second innings stay separate. Late-over means use the innings that actually reached and completed that over.
Average recorded innings score
176.46First innings · runs
168.31Second innings · runs
13 innings each. Early successful chases remain recorded totals, not 20-over projections.
Average powerplay score
54.69First innings · runs
55.85Second innings · runs
13 / 13 powerplays · overs 1–6.
Average powerplay wickets
1.77First innings · wickets
1.54Second innings · wickets
Recorded low–high: first 103–212; second 107–210.
Average runs per completed over
Venue-level means across the selected sample. Hover or select an over to see both averages and the exact denominators.
Select a point, tap a bar or use the keyboard for the exact values.
Score windows, totals and innings completion
First innings
| Measure | Value | Innings |
|---|---|---|
| Recorded total average | 176.46 | 13 |
| Full 20-over average | 177.27 | 11 |
| Recorded low–high | 103–212 | 13 |
| Powerplay runs | 54.69 | 13 |
| Powerplay wickets | 1.77 | 13 |
Second-innings chase-ended-early totals are retained but are not comparable with a full 20-over innings. Missing overs are never treated as zero.
Second innings
| Measure | Value | Innings |
|---|---|---|
| Recorded total average | 168.31 | 13 |
| Full 20-over average | 163.25 | 4 |
| Recorded low–high | 107–210 | 13 |
| Powerplay runs | 55.85 | 13 |
| Powerplay wickets | 1.54 | 13 |
Second-innings chase-ended-early totals are retained but are not comparable with a full 20-over innings. Missing overs are never treated as zero.
First-innings score bands
How often does each score band occur?
13 recorded first innings · 23 Mar 2025–18 May 2026. Early second-innings chases are not mixed into these bands.
Select a point, tap a bar or use the keyboard for the exact values.
Where are wickets lost?
Recorded team wickets in powerplay, middle and death overs. Includes run-outs; not the same as bowler-credited wickets.
Select a point, tap a bar or use the keyboard for the exact values.
C / Observed outcomes
Batting first vs chasing at Chepauk in IPL
Historical outcomes in decisive completed matches. This is not a match prediction.
Which innings situation won more often?
30.77%Batting first · 4/13
69.23%Chasing · 9/13
13 decisive matches · 23 Mar 2025–18 May 2026. Ties/no-results are not ordinary wins or losses.
4 batting-first wins; 9 chasing wins.
D / Bowling intelligence
Chepauk IPL bowling: pace vs spin
Source-profile classifications only. Unclassified bowlers remain visible in the sample denominator.
65 classified / 154 recorded credited wickets; 89 unclassified. A partial sample is not a complete pace/spin verdict.
Pace vs spin — classified wickets
First and second innings, with unclassified wickets shown separately.
Select a point, tap a bar or use the keyboard for the exact values.
Pace bowling by phase
Wickets from the source-classified pace subset only.
Select a point, tap a bar or use the keyboard for the exact values.
Spin types — classified wickets
Leg-spin, finger-spin and off-spin only where a source explicitly supports the classification.
Select a point, tap a bar or use the keyboard for the exact values.
Exact bowling comparison and source coverage
First innings
| Verified classification | Wickets | Runs conceded | Economy | Legal balls | Bowler innings |
|---|---|---|---|---|---|
| Pace | 18 | 256 | 8.00 | 192 | 8 |
| Spin | 17 | 270 | 8.18 | 198 | 10 |
53 unclassified wickets remain outside pace/spin allocation, not excluded from recorded wicket totals.
Second innings
| Verified classification | Wickets | Runs conceded | Economy | Legal balls | Bowler innings |
|---|---|---|---|---|---|
| Pace | 18 | 507 | 9.03 | 337 | 17 |
| Spin | 12 | 316 | 8.82 | 215 | 11 |
36 unclassified wickets remain outside pace/spin allocation, not excluded from recorded wicket totals.
E / Batting position intelligence
IPL batting-position records at Chepauk
Actual scorecard order: openers 1–2, No. 3, middle order 4–6 and lower order 7+.
14/26 innings have matched batting-order records. 12 innings remain unavailable for positional analysis.
Runs by batting-position group
First and second innings side by side. Hover for runs, appearances, dismissals and rate; group size differs.
Select a point, tap a bar or use the keyboard for the exact values.
Raw aggregate runs do not prove that one position is superior. Groups cover different numbers of positions; some appearances have very small samples.
Batting positions: average, strike rate and dismissals
First innings
| Position group | Runs | Average | Strike rate | Dismissals | Appearances |
|---|---|---|---|---|---|
| Openers · 1–2 | 480 | 40.00 | 149.07 | 12 | 14 |
| No. 3 | 245 | 35.00 | 166.67 | 7 | 7 |
| Middle order · 4–6 | 384 | 24.00 | 133.80 | 16 | 19 |
| Lower order · 7+ | 135 | 22.50 | 155.17 | 6 | 14 |
Second innings
| Position group | Runs | Average | Strike rate | Dismissals | Appearances |
|---|---|---|---|---|---|
| Openers · 1–2 | 466 | 35.85 | 158.50 | 13 | 14 |
| No. 3 | 268 | 44.67 | 162.42 | 6 | 7 |
| Middle order · 4–6 | 353 | 29.42 | 142.34 | 12 | 17 |
| Lower order · 7+ | 129 | 25.80 | 144.94 | 5 | 11 |
F / Venue performers
Chepauk IPL player records
Two distinct windows, transparent runs/wickets rankings and individual samples. No player selection recommendations.
Recent venue performers · IPL 2025–2026
Recent top batters
Both innings · selected recent window · 13 venue matches
1
RD Gaikwad10 batting innings
306 runs2
SV Samson7 batting innings
247 runs3
S Dube12 batting innings
236 runsView recent ranking and exact sample
| Batter | Runs | Average | SR | Innings | Dismissals |
|---|---|---|---|---|---|
| RD Gaikwad | 306 | 38.25 | 129.11 | 10 | 8 |
| SV Samson | 247 | 41.17 | 169.18 | 7 | 6 |
| S Dube | 236 | 33.71 | 133.33 | 12 | 7 |
| A Mhatre | 207 | 41.40 | 171.07 | 5 | 5 |
| D Brevis | 171 | 28.50 | 133.59 | 6 | 6 |
| Kartik Sharma | 122 | 30.50 | 134.07 | 5 | 4 |
| SS Iyer | 122 | 61.00 | 174.29 | 2 | 2 |
| Ishan Kishan | 114 | 57.00 | 140.74 | 2 | 2 |
| R Ravindra | 113 | 37.67 | 124.18 | 4 | 3 |
| SM Curran | 109 | 27.25 | 137.97 | 4 | 4 |
Recent top bowlers
Both innings · selected recent window · 13 venue matches
1
Noor Ahmad13 bowling innings
21 wkts2
A Kamboj10 bowling innings
15 wkts3
KK Ahmed9 bowling innings
11 wktsView recent ranking and exact sample
| Bowler | Wickets | Average | Economy | SR | Innings |
|---|---|---|---|---|---|
| Noor Ahmad | 21 | — | 8.19 | — | 13 |
| A Kamboj | 15 | — | 9.09 | — | 10 |
| KK Ahmed | 11 | — | 8.35 | — | 9 |
| J Overton | 8 | — | 8.06 | — | 5 |
| PJ Cummins | 5 | — | 6.12 | — | 2 |
| YS Chahal | 5 | — | 8.83 | — | 2 |
| M Pathirana | 5 | — | 9.27 | — | 4 |
| SP Narine | 4 | — | 4.25 | — | 2 |
| HV Patel | 4 | — | 7.00 | — | 1 |
| JR Hazlewood | 3 | — | 5.25 | — | 1 |
All-time available IPL venue record · Howstat
Historical top batters
Howstat IPL venue record · 23 Apr 2008–18 May 2026
1
M S Dhoni65 batting innings
1547 runs2
S K Raina55 batting innings
1498 runs3
R D Gaikwad25 batting innings
1012 runsView historical ranking and exact sample
| Batter | Runs | Average | SR | Innings | Dismissals |
|---|---|---|---|---|---|
| M S Dhoni | 1547 | 40.71 | 144.31 | 65 | 38 |
| S K Raina | 1498 | 29.96 | 135.44 | 55 | 50 |
| R D Gaikwad | 1012 | 50.60 | 136.39 | 25 | 20 |
| M Vijay | 928 | 33.14 | 133.91 | 30 | 28 |
| M E K Hussey | 848 | 47.11 | 125.82 | 21 | 18 |
| S Dube | 637 | 35.39 | 152.03 | 27 | 18 |
| F du Plessis | 588 | 36.75 | 120.99 | 18 | 16 |
| R A Jadeja | 518 | 16.71 | 120.47 | 41 | 31 |
| J A Morkel | 486 | 28.59 | 147.27 | 26 | 17 |
| S Badrinath | 438 | 24.33 | 116.80 | 26 | 18 |
Historical top bowlers
Howstat IPL venue record · 23 Apr 2008–18 May 2026
1
R Ashwin47 matches
52 wkts2
D J J Bravo37 matches
44 wkts3
R A Jadeja55 matches
37 wktsView historical ranking and exact sample
| Bowler | Wickets | Average | Economy | SR | Matches | Overs |
|---|---|---|---|---|---|---|
| R Ashwin | 52 | 21.69 | 6.43 | 20.25 | 47 | 175.3 |
| D J J Bravo | 44 | 24.05 | 8.28 | 17.43 | 37 | 127.5 |
| R A Jadeja | 37 | 27.51 | 7.03 | 23.49 | 55 | 144.5 |
| J A Morkel | 36 | 23.67 | 7.99 | 17.78 | 31 | 106.4 |
| D L Chahar | 24 | 22.04 | 8.29 | 15.96 | 20 | 63.5 |
| Noor Ahmad | 22 | 19.18 | 8.12 | 14.18 | 14 | 52.0 |
| T U Deshpande | 21 | 21.95 | 8.95 | 14.71 | 14 | 51.3 |
| D E Bollinger | 20 | 19.50 | 7.38 | 15.85 | 14 | 52.5 |
| M Pathirana | 20 | 19.30 | 8.04 | 14.40 | 13 | 48.0 |
| M M Sharma | 19 | 21.63 | 7.47 | 17.37 | 16 | 55.0 |
Historical Howstat rankings are unaffected by recent-season filters. They use the ground's available IPL record, not all-format international totals.
Estimates withheld — historical evidence only
No calibrated score forecast or future win probability is available for this selected sample. Read the observed range and outcome record; weather, dew, strip and bounce are not connected.
Last played matchChennai Super Kings vs Sunrisers Hyderabad
2026-05-18 · 180/7 · 181/5
All selected match scorecards
| Date | Match | First innings | Second innings | Winner | Evidence |
|---|---|---|---|---|---|
| 2026-05-18 | Chennai Super Kings vs Sunrisers Hyderabad | 180/7 (20.0) | 181/5 (19.0) | Sunrisers Hyderabad | Independent score receipt |
| 2026-05-10 | Lucknow Super Giants vs Chennai Super Kings | 203/8 (20.0) | 208/5 (19.2) | Chennai Super Kings | Independent score receipt |
| 2026-05-02 | Mumbai Indians vs Chennai Super Kings | 159/7 (20.0) | 160/2 (18.1) | Chennai Super Kings | Independent score receipt |
| 2026-04-26 | Chennai Super Kings vs Gujarat Titans | 158/7 (20.0) | 162/2 (16.4) | Gujarat Titans | Independent score receipt |
| 2026-04-14 | Chennai Super Kings vs Kolkata Knight Riders | 192/5 (20.0) | 160/7 (20.0) | Chennai Super Kings | Independent score receipt |
| 2026-04-11 | Chennai Super Kings vs Delhi Capitals | 212/2 (20.0) | 189/10 (20.0) | Chennai Super Kings | Independent score receipt |
| 2026-04-03 | Chennai Super Kings vs Punjab Kings | 209/5 (20.0) | 210/5 (18.4) | Punjab Kings | Independent score receipt |
| 2025-04-30 | Chennai Super Kings vs Punjab Kings | 190/10 (19.2) | 194/6 (19.4) | Punjab Kings | Archive-only; receipt missing |
| 2025-04-25 | Chennai Super Kings vs Sunrisers Hyderabad | 154/10 (19.5) | 155/5 (18.4) | Sunrisers Hyderabad | Archive-only; receipt missing |
| 2025-04-11 | Chennai Super Kings vs Kolkata Knight Riders | 103/9 (20.0) | 107/2 (10.1) | Kolkata Knight Riders | Archive-only; receipt missing |
| 2025-04-05 | Delhi Capitals vs Chennai Super Kings | 183/6 (20.0) | 158/5 (20.0) | Delhi Capitals | Archive-only; receipt missing |
| 2025-03-28 | Royal Challengers Bengaluru vs Chennai Super Kings | 196/7 (20.0) | 146/8 (20.0) | Royal Challengers Bengaluru | Archive-only; receipt missing |
| 2025-03-23 | Mumbai Indians vs Chennai Super Kings | 155/9 (20.0) | 158/6 (19.1) | Chennai Super Kings | Archive-only; receipt missing |
Chepauk IPL pitch report: common questions
What is the average IPL score at Chepauk?
In the selected IPL 2025–2026 sample, the average recorded first-innings score is 176.46 runs and the second-innings average is 168.31 runs. Each uses 13 innings from 23 Mar 2025–18 May 2026. These are selected-match averages, not all-time IPL averages; successful early chases are not projected to 20 overs.
Is Chepauk better for batting or bowling in IPL?
There is no single batting-or-bowling verdict for every Chepauk pitch. This IPL report compares recorded scoring, wickets and pace/spin results. Only source-classified bowlers are allocated to pace or spin; partial coverage cannot establish a complete bowling-style advantage. Today's strip, weather and dew have not been assessed.
Does batting first or chasing win more often at Chepauk in IPL?
In this selected IPL 2025–2026 window, batting-first teams won 4/13 matches (30.77%) and chasing teams won 9/13 (69.23%). The dates are 23 Mar 2025–18 May 2026. These historical results are not future win probabilities or toss advice.
Does this report cover ODI and T20I matches?
No. This page is dedicated to IPL matches. Recent analysis offers the selected IPL 2025, IPL 2026 and combined 2025–2026 windows. The separate Howstat tables cover the available historical IPL ground leaderboard. ODI and T20I records are not loaded or mixed into this report.
Sources & Methodology
Coverage and date windows
Recent selection: IPL / T20 2025–2026, 13 completed matches, 26 innings, 23 Mar 2025–18 May 2026. 7/13 independent scorecard receipts; 6 archive-only records. The six 2025 records are a selected baseline; no complete-season coverage is claimed.
All-time section uses only the available Howstat IPL ground leaderboard. It stays distinct from recent filters and stores top 10 runs / wickets, not every participant. Displayed history: 23 Apr 2008–18 May 2026.
Howstat historical venue records
https://www.howstat.com/Cricket/Statistics/IPL/GroundStats.asp?GroundCode=012
https://www.howstat.com/Cricket/Statistics/IPL/GroundList.asp
https://www.howstat.com/Cricket/Statistics/IPL/GroundTopBatsmen.asp?GroundCode=012&Stat=2
https://www.howstat.com/Cricket/Statistics/IPL/GroundTopBowlers.asp?GroundCode=012&Stat=2
Scorecards and receipts
1529306 · 2026-05-18 · Chennai Super Kings vs Sunrisers Hyderabad
Verified scorecard receipt: Open stored receipt · Actual batting order
1529296 · 2026-05-10 · Lucknow Super Giants vs Chennai Super Kings
Verified scorecard receipt: Open stored receipt · Actual batting order
1529287 · 2026-05-02 · Mumbai Indians vs Chennai Super Kings
Verified scorecard receipt: Open stored receipt · Actual batting order
1529280 · 2026-04-26 · Chennai Super Kings vs Gujarat Titans
Verified scorecard receipt: Open stored receipt · Actual batting order
1529265 · 2026-04-14 · Chennai Super Kings vs Kolkata Knight Riders
Verified scorecard receipt: Open stored receipt · Actual batting order
1527691 · 2026-04-11 · Chennai Super Kings vs Delhi Capitals
Verified scorecard receipt: Open stored receipt · Actual batting order
1527680 · 2026-04-03 · Chennai Super Kings vs Punjab Kings
Verified scorecard receipt: Open stored receipt · Actual batting order
1473486 · 2025-04-30 · Chennai Super Kings vs Punjab Kings
2025 archive-only baseline. Independent scorecard receipt and batting-order classification are missing.
1473480 · 2025-04-25 · Chennai Super Kings vs Sunrisers Hyderabad
2025 archive-only baseline. Independent scorecard receipt and batting-order classification are missing.
1473462 · 2025-04-11 · Chennai Super Kings vs Kolkata Knight Riders
2025 archive-only baseline. Independent scorecard receipt and batting-order classification are missing.
1473454 · 2025-04-05 · Delhi Capitals vs Chennai Super Kings
2025 archive-only baseline. Independent scorecard receipt and batting-order classification are missing.
1473445 · 2025-03-28 · Royal Challengers Bengaluru vs Chennai Super Kings
2025 archive-only baseline. Independent scorecard receipt and batting-order classification are missing.
1473440 · 2025-03-23 · Mumbai Indians vs Chennai Super Kings
2025 archive-only baseline. Independent scorecard receipt and batting-order classification are missing.
Metric definitions
runs: Delivery runs.total; extras represented in the archive are retained.
wickets: Team wicket markers exclude retired hurt/not out; bowling credited wickets are bowled, caught, caught and bowled, lbw, stumped, and hit wicket.
legal ball: A delivery without wides or no-balls; batter balls exclude wides and bowler balls exclude wides and no-balls.
over means: Each over mean uses only innings with at least one delivery in that over; missing late overs are not zero.
phase means: Each phase mean uses only innings with at least one delivery in that phase.
checkpoint means: Only innings reaching the stated legal-ball checkpoint contribute; denominator is explicit.
chase comparability: Second-innings chase-ended-early totals are retained and separately counted; they are not treated as comparable full-20 totals.
stable ids: Player aggregation requires the exact match registry person ID; unresolvable names are omitted rather than assigned guessed IDs.
Batting average = runs / dismissals; zero dismissals means unavailable, not infinity. Batting SR = 100 × runs / balls faced (wides excluded). Bowling economy = 6 × conceded runs / legal balls; byes/leg-byes excluded. Bowling strike rate = legal balls / credited wickets. Dismissals such as run-out/retired-out count to batting dismissals, but not bowler wickets.
Inclusion and exclusions
Normal completed two-innings IPL matches only; no-result, abandoned, adjusted/shortened matches, super overs and incomplete records are excluded. All-out and successful early chases are retained as recorded totals, never labelled full 20-over innings unless they reached 120 legal balls. Never substitute zero for a missing over. Completed-over comparisons and checkpoint means expose their contributing innings.
Batting positions and bowling styles
Positions use actual full-scorecard batting order, joined to stable registry IDs. 14 innings have matched source orders. Missing or ambiguous identities are not inferred from entry sequence. Pace/spin allocations require source-profile bowling style; 65 classified and 89 unclassified credited wickets in this selection. Partial classification cannot support a claim about all bowlers.
Verified bowling-style ledger · Original independent aggregate audit · Original metric QA
Historical, estimated and live
Historical score/win percentages are not predictive probabilities. This selected sample has no calibrated forecast. Weather, dew, strip, bounce and rope inputs are not connected. IPL/T20 only: ODI/T20I/BBL data and format-specific calculations are not loaded. No player-pick, captain or vice-captain recommendations.
Venue photography: https://www.hopkins.co.uk/projects/sport/chepauk-stadium/ · archive: https://cricsheet.org/downloads/ · Data licence