

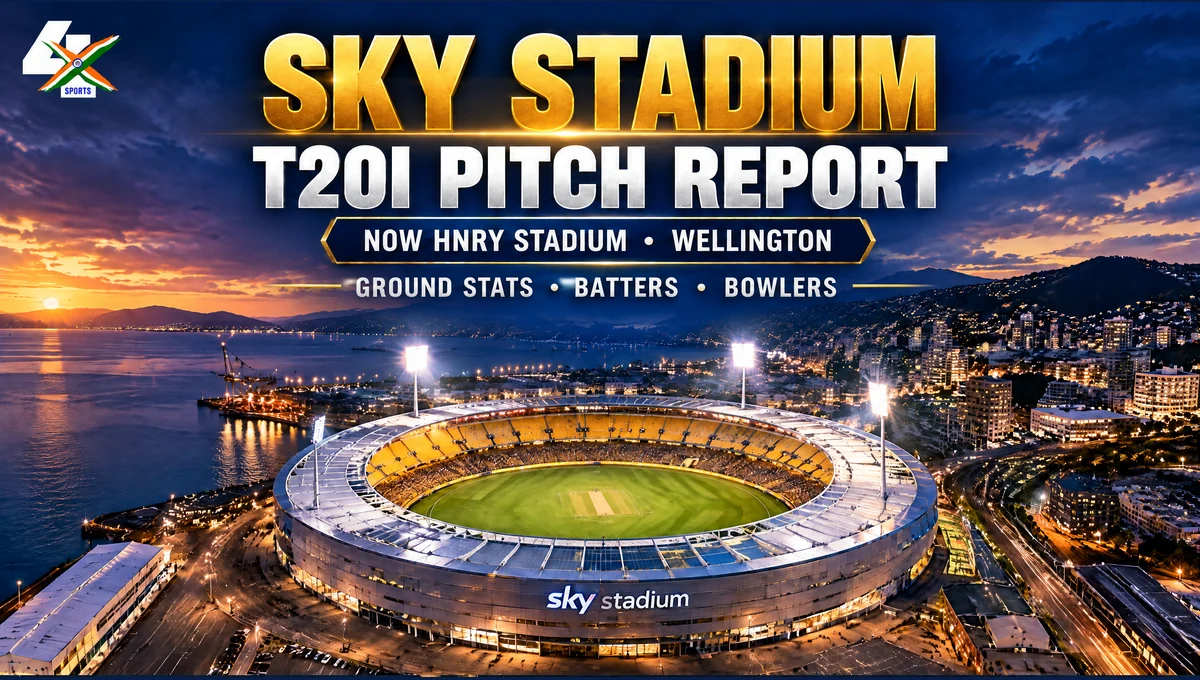
The Sky Stadium T20I pitch report covers Wellington Regional Stadium, now called Hnry Stadium. It is the same ground once known as Westpac Stadium. Batters can score quickly here, but both pace and spin have taken important wickets. The completed-match first-innings average is 163.56.
This is an overall men’s T20I guide, not a forecast for one fixture. Basin Reserve is a different Wellington ground and is not included.
Ground Overview
| Detail | Ground Information |
|---|---|
| Ground | Wellington Regional Stadium |
| Current Name | Hnry Stadium |
| Earlier Names | Sky Stadium, Westpac Stadium, WestpacTrust Stadium |
| City | Wellington, New Zealand |
| Format Covered | Men’s T20Is |
| Ground Excluded | Basin Reserve |
The sponsor name has changed. The ground’s identity has not. Records under the listed aliases belong to this one stadium.
This report covers men’s T20Is at the exact regional stadium only. It does not include Basin Reserve. The records sample contains 18 completed scorecards and one separate match abandoned without a ball. The future fixtures listed below are not part of the historical statistics.
Sky Stadium T20I Statistics
| Record | Figure |
|---|---|
| Historical Fixtures Listed, Including A No-Ball Abandonment | 19 |
| Played Matches With Completed Scorecards | 18 |
| First-Innings Average | 163.56 runs from 18 innings |
| Second-Innings Average, Including The DLS Chase | 140.00 runs from 18 innings |
| Second-Innings Average, Excluding The DLS Chase | 144.59 runs from 17 innings |
| Batting-First Wins, Excluding The Tied Match | 7 |
| Chasing Wins, Excluding The Tied Match | 10 |
| Regulation Ties | 1; India won the Super Over in 2020 |
| Abandoned Without A Ball Bowled | 1, on 18 November 2022 |
| Highest Team Total | New Zealand, 219/6 against India on 6 February 2019 |
| Lowest Innings Total, Including DLS Chases | Sri Lanka, 62/1 in a 5.5-over chase in 2006 |
| Lowest Team Total In A Standard-Length Match | Pakistan, 101 all out against New Zealand in 2016 |
| Highest Successful Chase | Australia, 216/4 against New Zealand in 2024 |
The first innings total 2,944 runs. The second innings total 2,520, including Sri Lanka’s shortened DLS chase. Without that chase, the second-innings sample is 2,458 runs from 17 innings. That is why the two second-innings averages differ.
The no-ball abandonment is excluded from the innings averages. Super Over runs are also excluded from normal innings figures. Completed chases and all-out innings can finish before 20 overs, so these are not averages of innings that all lasted 20 overs.
Detailed Pitch Behaviour
Batting
The record supports a good scoring surface when batters use the pace early. The first innings has averaged 163.56, and the highest total is New Zealand’s 219/6 against India in 2019. Australia then chased 216/4 against New Zealand in 2024, the highest successful chase at the ground.
Recent games show the range clearly. South Africa made 164/5 before beating New Zealand by 19 runs in 2026. Pakistan made 128/9 in 2025, but New Zealand reached 131/2 in 10 overs. The 2024 match reached 431 aggregate runs. These scorecards support a batting-friendly ceiling, not one fixed outcome.
Pace
Seam has a strong record in the ground’s wicket table. Tim Southee has 17 T20I wickets here, Trent Boult has eight, Adam Milne six and Lockie Ferguson five. James Neesham’s 5/22 in 2025 is the best recent return.
The scorecards suggest that pace can matter both at the start and at the end. Australia made 208/4 in 2021, while South Africa’s 164/5 in 2026 was defended against a New Zealand side dismissed for 145. That is evidence from named matches, not a claim that every surface will play identically.
Spin
Spin is not a minor part of the venue record. Ish Sodhi leads all T20I bowlers here with 18 wickets, and Mitchell Santner has 13. The ground’s best match analysis is Ashton Agar’s 6/30.
The bowling table therefore points to value for accurate spin through the middle overs. It does not mean spin will always dominate. The recent 2025 chase, completed in 10 overs, shows how quickly a batting side can take control when the start is clean.
Phases
Across the 18 completed scorecards, first-innings phase means were 45.83 runs in overs 1–6, 69.78 in overs 7–15, and 47.94 in overs 16–20.
Second-innings phase means across all 18 scorecards were 52.39, 63.61, and 24.00. The last figure is not a full-20-over benchmark because the sample includes the five-over DLS chase in 2006 and a 10-over chase in 2025. Read it as a scorecard pattern, not a universal late-overs expectation.
Recent Completed T20Is
| Date | Match | Score | Result |
|---|---|---|---|
| 22 March 2026 | South Africa v New Zealand | South Africa 164/5; New Zealand 145 all out | South Africa won by 19 runs |
| 26 March 2025 | Pakistan v New Zealand | Pakistan 128/9; New Zealand 131/2 in 10 overs | New Zealand won by 8 wickets |
| 21 February 2024 | New Zealand v Australia | New Zealand 215/3; Australia 216/4 | Australia won by 6 wickets |
| 7 March 2021 | Australia v New Zealand | Australia 142/8; New Zealand 143/3 | New Zealand won by 7 wickets |
A separate 18 November 2022 T20I between New Zealand and India was abandoned without a ball. It is not included in completed-match means.
Top 10 Batters At This Ground
Matches means appearances at this ground, not batting innings. Average is runs per dismissal. A highest-score asterisk means not out. These are historical ground leaders, not current squad picks.
| Rank | Player | Country | Matches | Runs | 50s | 100s | Highest Score | Average |
|---|---|---|---|---|---|---|---|---|
| 1 | Martin Guptill | New Zealand | 13 | 453 | 4 | 0 | 78* | 37.75 |
| 2 | Tim Seifert | New Zealand | 8 | 291 | 3 | 0 | 97* | 58.20 |
| 3 | Ross Taylor | New Zealand | 11 | 206 | 0 | 0 | 39 | 25.75 |
| 4 | Aaron Finch | Australia | 3 | 184 | 2 | 0 | 79* | 92.00 |
| 5 | Kane Williamson | New Zealand | 7 | 180 | 1 | 0 | 72 | 25.71 |
| 6 | Colin Munro | New Zealand | 8 | 175 | 1 | 0 | 64 | 25.00 |
| 7 | Brendon McCullum | New Zealand | 6 | 169 | 1 | 0 | 69* | 33.80 |
| 8 | Devon Conway | New Zealand | 4 | 154 | 1 | 0 | 63 | 38.50 |
| 9 | Alex Hales | England | 2 | 127 | 1 | 0 | 80* | 127.00 |
| 10 | Glenn Maxwell | Australia | 4 | 114 | 1 | 0 | 70 | 28.50 |
Top 10 Bowlers At This Ground
Economy is runs per six legal balls. Average is runs per wicket. Strike rate is legal balls per wicket. BBI means best bowling in one innings. Source-displayed rounding is retained.
| Rank | Player | Country | Matches | Wickets | Economy | Average | Strike Rate | BBI |
|---|---|---|---|---|---|---|---|---|
| 1 | Ish Sodhi | New Zealand | 10 | 18 | 8.33 | 18.05 | 13.00 | 3/24 |
| 2 | Tim Southee | New Zealand | 11 | 17 | 7.63 | 19.76 | 15.52 | 3/13 |
| 3 | Mitchell Santner | New Zealand | 9 | 13 | 6.21 | 15.76 | 15.23 | 3/25 |
| 4 | Ashton Agar | Australia | 3 | 8 | 5.58 | 8.37 | 9.00 | 6/30 |
| 5 | Trent Boult | New Zealand | 6 | 8 | 9.04 | 23.75 | 15.75 | 2/26 |
| 6 | Adam Milne | New Zealand | 3 | 6 | 7.43 | 13.83 | 11.16 | 3/8 |
| 7 | James Neesham | New Zealand | 7 | 5 | 10.72 | 38.60 | 21.60 | 5/22 |
| 8 | Lockie Ferguson | New Zealand | 3 | 5 | 6.58 | 15.80 | 14.40 | 2/22 |
| 9 | Chris Jordan | England | 2 | 4 | 7.12 | 14.25 | 12.00 | 3/23 |
| 10 | Riley Meredith | Australia | 3 | 4 | 7.55 | 20.75 | 16.50 | 2/24 |
Upcoming Matches At Sky Stadium
| Date | Match | Series | Format | Time In India | Local Time |
|---|---|---|---|---|---|
| 27 October 2026 | New Zealand Vs India, 3rd T20I | India Tour Of New Zealand | T20I | 12:30 PM IST | 8:00 PM NZDT |
| 7 November 2026 | New Zealand Vs India, 2nd ODI | India Tour Of New Zealand | ODI | 7:30 AM IST | 3:00 PM NZDT |
The ODI is listed for scheduling only. Its records are not part of this T20I guide. Find more venues in the 4xSports pitch report library.
Key Ground Records
- Most T20I runs: Martin Guptill, 453.
- Most T20I wickets: Ish Sodhi, 18.
- Highest innings total: New Zealand 219/6 v India in 2019.
- Highest successful chase: Australia 216/4 v New Zealand in 2024.
- Highest individual score: Tim Seifert’s 97 not out v Pakistan in 2025.
- Best match bowling: Ashton Agar’s 6/30 v New Zealand in 2021.
- First-innings mean: 163.56 from 2,944 runs in 18 completed scorecards.
- Result split: 7 batting-first wins, 10 chasing wins, one tie; one separate abandonment without a ball.
Sky Stadium Pitch Report FAQs
Is Hnry Stadium The Same Ground As Sky Stadium And Westpac Stadium?
Yes. Hnry Stadium, Sky Stadium, Westpac Stadium and WestpacTrust Stadium are naming aliases for Wellington Regional Stadium. Basin Reserve is a different ground and is excluded here.
Is Wellington Regional Stadium Good For Batting?
The completed men’s T20I first innings average is 163.56. The ground has also produced 219/6 and a successful chase of 216/4. That supports a strong scoring ceiling, while the full scorecard set also includes lower totals.
Does Spin Matter Here?
Yes, the exact-ground wicket table is led by Ish Sodhi with 18 and Mitchell Santner with 13. Ashton Agar’s 6/30 is the best match return. These are historical records, not a forecast for every future game.
Who Has Scored The Most Runs?
Martin Guptill leads with 453 runs. Tim Seifert is second with 291 and owns the highest individual score in the table at 97 not out.
Who Has Taken The Most Wickets?
Ish Sodhi leads with 18 wickets, followed by Tim Southee with 17 and Mitchell Santner with 13.
What Is The Mean First-Innings Score?
It is 163.56, calculated from 2,944 runs across 18 completed first innings. The denominator is shown because the venue also has a reduced DLS chase in the historical sample.
Is Batting First Or Chasing More Successful?
Chasing has won 10 of the 17 decided completed matches. Batting first has won seven, and one match was tied. One additional match was abandoned without a ball.
Source cutoff: 15 October 2026. Records use the exact Wellington Regional Stadium ground under its Hnry, Sky and Westpac aliases. Reduced-over and abandoned matches are labelled rather than silently blended into full-match means.
